
Abstract
T cells are critical effectors of cancer immunotherapies, but little is known about their gene expression programs in diffuse gliomas. Here, we leverage single-cell RNA sequencing (RNA-seq) to chart the gene expression and clonal landscape of tumor-infiltrating T cells across 31 patients with isocitrate dehydrogenase (IDH) wild-type glioblastoma and IDH mutant glioma. We identify potential effectors of anti-tumor immunity in subsets of T cells that co-express cytotoxic programs and several natural killer (NK) cell genes. Analysis of clonally expanded tumor-infiltrating T cells further identifies the NK gene KLRB1 (encoding CD161) as a candidate inhibitory receptor. Accordingly, genetic inactivation of KLRB1 or antibody-mediated CD161 blockade enhances T cell-mediated killing of glioma cells in vitro and their anti-tumor function in vivo. KLRB1 and its associated transcriptional program are also expressed by substantial T cell populations in other human cancers. Our work provides an atlas of T cells in gliomas and highlights CD161 and other NK cell receptors as immunotherapy targets.
Methods
scRNA-seq data processing (SMART-Seq2)
We processed sequencing data from raw reads to gene expression matrices as previously described. Briefly, we used bcl2fastq to generate demultiplexed FASTQ files, and aligned the resulting paired-end scRNA-seq reads to the human transcriptome (hg19) using Bowtie (v0.12.7) . We quantified gene expression levels from these alignments as transcripts-per-million (TPM) values by running RSEM (v1.2.19) in paired-end mode . We normalized the total transcripts per cell to one-hundred thousand (TP100K), as this is our estimated complexity of single-cell libraries prepared by SMART-Seq2, and then log-transformed these values to report gene expression as E = ln(TP100K+1).
Quality control of scRNA-seq (SMART-Seq2)
For each cell, we considered a gene to be detected if its TP100K > 0. We excluded all cells with either < 500 or > 7,500 unique genes detected, or with fewer than 20 housekeeping genes detected based on a previously curated gene set. Three patient samples (E88, E119, and MGH142), where the majority of T cells failed to meet these criteria, were completely omitted from further analysis.
To ensure our studied cell population consisted only of T cells, we carried out an initial round of graph-based clustering, described below, to identify cell types that might have been flow-sorted with the T cells. We first identified and removed B cells, myeloid cells, and astrocytes. We next identified NK cells and cell doublets by carrying out clustering using non-negative matrix factorization (NMF) with the Brunet algorithm and 7 factors in the factorization. This was implemented in the R package NMF (v0.21.0). We identified doublets as a distinct cluster of cells expressing both T cell markers (CD3D, CD3E, CD3G) and either astrocyte markers (GFAP) or myeloid markers (C1QB, C1QC). We searched for potential NK cells by examining the cluster of CD8 T cells, as NK cells and CD8 T cells share transcriptional programs. We identified a small cell population (127 cells) within the cluster of CD8 T cells with low mean expression (ln(TP100K+1) < 1) of T cell markers (CD3D, CD3E, CD3G, CD247). We identified differentially expressed genes, as described below, between this cell population and the remaining CD8 T cells and found that this population had lower expression of other T cell markers (CD5, IL7R, CD8A, CD8B) and higher expression of NK markers (KIR2DL1, KIR2DL3, KIR2DS4). To ensure our results were not confounded by NK cells, we removed this population. The above filtering steps removed 8% of the cells. Finally, we also excluded a small percentage of cells (2%) that were either cycling T cells that expressed both CD4 and CD8, cycling T cells that lacked expression of CD4 and CD8, or Tregs that expressed CD8. Positive gene expression was defined as ln(TP100K+1) > 1 and lack of gene expression was defined as ln(TP100K+1) < 1. After these quality control steps, overall we retained 8,252 T cells from 27 glioma samples (from 26 patients), with a total of 22,448 genes detected in at least one cell. These T cells are used in all analyses reported in this work (clustering, cell type and cell state identification, clonal expansion, pan-cancer metaanalysis).
Cell type and cell state identification (SMART-Seq2)
We carried out analyses of all T cells to identify cell types, states, and their corresponding gene signatures using the R package Seurat (v2.3.4) (https://github.com/satijalab/seurat) (Butler et al., 2018). We chose highly variable genes for clustering analyses using FindVariableGenes, which controls for the inherent relationship between the mean and the variance of gene expression. We used the following thresholds for the mean expression (x) and the variance to mean ratio (y): x.low.cutoff = 0.1, x.high.cutoff = 7, y.cutoff = 0.5. We identified variable genes within each patient sample and selected the 1,500 variable genes that were most commonly shared across all patient samples. Next, we centered the expression of each gene to have a mean of zero using ScaleData and performed Principal Components Analysis (PCA) with RunPCA. We performed graph-based Louvain clustering on the top 20 principal components using FindClusters, with the resolution parameter set to 0.7 and k for the k-nearest neighbor algorithm set to 30. We identified differentially expressed genes for each cluster of cells using the t test implemented in FindMarkers while adjusting p values for multiple hypothesis testing with the Bonferroni correction. Finally, we visualized gene expression and clustering results on a Uniform Manifold Approximation and Projection embedding (UMAP) of the top twenty PCs using RunUMAP with the following settings: min_dist = 0.5, number of neighbors = 30, and distance metric = Euclidean.
To sub-cluster CD4 T cells (4,369 cells) or CD8 T cells (3,883 cells), we carried out clustering using NMF (Figure 1E). When clustering CD4 T cells and CD8 T cells, we used 6 factors in the factorization, and when clustering all glioma T cells found in clonotypes, we used 4 factors. As an alternative to NMF clustering, we also carried out graph-based Louvain clustering using resolution parameters of 0.5 and 0.7 for CD4 and CD8 T cells respectively. We calculated UMAP visualizations for the CD4 T cells and CD8 T cells using the top twenty PCs as input features, and the same settings as above.
We annotated the cell type or state represented by each cluster by considering the cluster’s differentially expressed genes together with the known cell type markers CD3D, CD3E, CD3G, CD4, CD8A, CD8B, and FOXP3. To identify a cell’s state in the cell cycle, we used CellCycleScoring, which scores the levels of programs for S phase and G2/M phase using previously defined gene sets for DNA replication and mitosis (Tirosh et al., 2016a).
To examine gene expression signatures within single cells, we scored the levels of specific signatures using AddModuleScore, which calculates the average expression levels of the genes in a signature and then subtracts off the average expression levels of control gene sets (Tirosh et al., 2016a). Control gene sets were chosen to have similar expression values to the genes in the signature. All genes were binned into 25 bins based on their average expression across all cells, and for each gene in a signature, a random set of 20 genes was chosen from the same average expression bin as that gene. This procedure controls a signature’s expression level for the differences in cell quality and library complexity across single cells. We defined cytotoxicity, NK, and inhibitory signature scores based on established marker genes. For the cytotoxicity signature, we included the genes PRF1, GZMB, GZMA, GZMH, NKG7, and GNLY, for the NK signature, we included the genes KLRD1, FGFBP2, FCGR3A, S1PR5, KLRC1, KLRC3, KLRB1, and KLRC2, and for the inhibitory signature, we included the genes PDCD1, CTLA4, HAVCR2, LAG3, and TIGIT. We defined a CD8 T cell as having a high NK signature score if it had an NK signature score > 0.5; otherwise we defined the cell as having a low NK signature score. We then identified the differentially expressed genes between the high NK and low NK signature score CD8 T cells using FindMarkers as described above. We confirmed that the top differentially expressed genes were not sensitive to the threshold used to define cells as having a high NK versus a low NK signature score by repeating the analyses with thresholds of 0 and of 1.
We identified significant changes in cell type proportions under different treatment regimes (prior corticosteroids or immune checkpoint inhibitors) or in different glioma classes (GBM or IDH-G) using a Dirichlet-multinomial regression model.
Differential gene expression in IDH-G and GBM T cells (SMART-Seq2)
To look for variability between the expression profiles of CD4 and CD8 T cells isolated from IDH-G and GBM, we used the FindMarkers function to identify differentially expressed genes between cells of the two tumor classes of a given subset. For three subsets, Interferon, Cytotoxicity, and Stress, we calculated the signature scores for the list of DE genes using AddModuleScore and compared the signature scores between the two classes by a two-sample Komolgorov-Smirnov test.
KLRB1 and tissue resident memory T cell signature comparison (SMART-Seq2 and 5′ end scRNA-Seq)
In order to determine if any of the subsets of T cells we identified were Tissue Resident Memory T Cells (Trms), we first calculated a signature score using AddModuleScore for a Trm signature (CA10, ITGA1, ITGAE, IL2, IL10, CXCR6, CXCL13, KCNK5, RGS1, CRTAM, DUSP6, PDCD1) and the expression of KLRB1. We then calculated the Pearson correlation coefficients between the Trm signature and KLRB1 expression in all CD4 T cells, all CD8 T cells, and their respective subsets of cells.
Reconstructing TCR chain sequences (SMART-Seq2)
For each single T cell, we computationally reconstructed its TCR α and β chain sequences from the corresponding scRNA-seq data using TraCeR (v0.6.0, https://github.com/Teichlab/tracer) (Stubbington et al., 2016). We ran TraCeR assembly with the following Trinity (Grabherr et al., 2011) settings in our configuration file: inchworm_only = True and trinity_kmer_length = 15. We classified a T cell as having a reconstructed TCR if we could reconstruct productive sequences for α and/or β chains. We defined clonotypes based on grouping T cells sharing an identical α and/or β chain, and we reported the size of the clonotype as the number of cells in this grouping. We defined a T cell as a singleton if it had a reconstructed TCR that did not share an identical α and/or β chain with any other T cell from that same tumor.
Differential gene expression in clonal cells (SMART-Seq2)
To compare expression levels between clonal and non-clonal T cells, we first calculated the mean expression of each gene in these respective populations. These populations differ in cell composition and cell quality across different patient tumors. To control for this, we matched every clonotype in each patient tumor with ten sets of non-clonal T cells randomly drawn from that same patient tumor. Each randomly selected set of non-clonal T cells had the same number of cells as the corresponding clonotype, and each selected T cell was a singleton. For each gene, we calculated its mean expression value across all cells in clonotypes from all tumors, and across all random sets of non-clonal cells from all tumors, and subtracted its mean expression in all non-clonal cells from its mean expression in clonal cells. Because we take the mean expression value across all cells from all clonotypes, this gives greater weight to clonotypes with greater size.
To compare expression variability between clonal and non-clonal T cells we followed a similar approach. To quantify variability of each gene for clonal cells, we calculated the L1 distance between the expression of a gene in cell x and in cell y in the same clonotype. (We used L1 and not L2, because squaring the expression difference will emphasize larger differences, which are often driven by technical noise in scRNA-seq.) For each clonotype from each patient tumor, we calculated the L1 distances for every possible pair of cells within the clonotype, and then calculated the mean distance across all these distances. We divided this mean L1 distance by the gene’s mean expression across all cells from all clonotypes (as above), to get a coefficient of variation (CV). To quantify variability of each gene for non-clonal cells, we use the same approach but instead calculated L1 distances within the random sets of non-clonal cells, with non-clonal cells defined as above. We finally calculated the difference in CV values between clonal and non-clonal cells. We excluded genes with low mean expression in both the clonal and nonclonal cells (ln(TP100K+1) < 0.1) as these genes would have greatly inflated CV values and not be reliably quantified.
To test for each gene whether the differences in mean expression or CV are significantly different between clonal and non-clonal cells, we empirically generated a background distribution. We shuffled the expression values between clonal and non-clonal cells for each gene and calculated the differences in mean expression and CV for this shuffled expression data. We repeated this 100 times for each gene and then calculated a z-score of the observed difference relative to this empirical null distribution. If the magnitude of the z-score was greater than 3, the observed difference in the actual data was more extreme than any of the values in the empirical null distribution.
scRNA-seq data processing (5′ end scRNA-seq)
We processed raw sequencing reads from both library types (gene expression and V(D)J) to generate gene expression matrices and to reconstruct TCR alpha and beta chain sequences. For both library types, we demultiplexed FASTQ files from the raw sequencing reads using Cell Ranger mkfastq (v3.1) (10x Genomics). For the gene expression libraries, we then aligned these reads to the human GRCh38 genome (refdata-cellranger-GRCh38-3.0.0) using Cell Ranger count (v3.1) (10x Genomics). We normalized the total number of unique molecular identifiers (UMIs) per cell to ten thousand (TP10K) and then log-transformed these values to report gene expression as E = ln(TP10K+1). For the V(D)J libraries, we assembled the sequencing reads into contigs and annotated the segments and CDR3 regions using Cell Ranger vdj (v3.1) (10x Genomics) and a V(D)J reference (refdata-cellranger-vdj-GRCh38-alts-ensembl-3.1.0). We used the clonotype groups as determined by Cell Ranger vdj, where cells in a clonotype share the same productive CDR3 nucleotide sequence.
Quality control of scRNA-seq (5′ end scRNA-seq)
For each cell, we considered a gene to be detected if its TP10K > 0. We excluded all cells with < 400 UMIs detected, either < 200 or > 5,000 unique genes detected, or with > 10% of UMIs coming from mitochondrial genes. As with our SMART-Seq2 analysis, we carried out an initial round of clustering, described below, to identify and remove cells that were not T cells or droplets that contained cell doublets. We first identified and removed myeloid cells and astrocytes. We then identified and removed two types of cell doublets: T cells expressing CD4, CD8A, and CD8B, and a cluster of Tregs expressing CD8. After these quality control steps, overall we retained 25,256 T cells from 5 glioma samples (from 5 patients). These T cells are used in all analyses reported in this work.
Cell type and cell state identification (5′ end scRNA-seq)
To identify the cell states present in CD4 T cells (3,665 cells) and CD8 T cells (21,502 cell), we used Seurat (v3.2.0). In order to perform batch correction and identify highly variable genes in the two populations of T cells, we split the data by sample, used NormalizeData to normalize gene expression, and identified variable genes using FindVariableFeatures. In order to integrate the samples, we used FindIntegrationAnchors to identify shared variable genes across samples and used SelectIntegrationFeatures to integrate the datasets. We then centered mean gene expression across all samples to zero using ScaleData and performed Principle Components Analysis (PCA) using RunPCA. We then used Louvain clustering on the top 20 principal components (PCs) using FindNeighbors, with the k-nearest neighbor algorithm set to 20, and FindClusters, with the resolution parameter set to 1. For two-dimensional visualization, we employed Uniform Manifold Approximation and Projection embedding (UMAP) using RunUMAP (min.dist = 0.5, number of neighbors = 15, and distance metric = Euclidean). Lastly, to identify differentially expressed genes we implemented FindAllMarkers.
In order to identify the different cell states in the CD4 T cells and CD8 T cells, we clustered these subpopulations using NMF. For clustering of the CD4 T cells, we used 8 factors; when clustering the CD8 T cells we used 9 factors. We then generated UMAP visualizations of the CD4 T cells and CD8 T cells using the top 20 PCs as described above. We used the differentially expressed genes and known cell type markers to annotate the cell type or cell state of each cluster identified using NMF.
Differential gene expression in clonal cells (5′ end scRNA-seq)
To compare expression levels in clonally expanded CD4 and CD8 T cells, we first binned cells by expression of KLRB1, those cells with KLRB1 expression greater than zero were deemed KLRB1-positive and those with expression less than or equal to zero were deemed KLRB1-negative. We then used FindMarkers to identify differentially expressed genes between the KLRB1-positive and KLRB1-negative populations.
Analysis of gene expression in additional scRNA-seq glioma datasets
To examine gene expression from malignant cells, myeloid cells and glial cells in diffuse gliomas, we analyzed our published, quality-controlled, scRNA-seq datasets for IDH mutant oligodendroglioma, IDH mutant astrocytoma, and IDH-wild-type GBM. Gene expression was given in units of ln(TP100K+1), and malignant cells, myeloid cells, and oligodendrocytes were identified based on the cell-type annotations provided in our published studies.
Analysis of gene expression by tumor-infiltrating T cells in additional scRNA-seq cancer datasets
We collected processed scRNA-seq datasets for the following human cancers: melanoma (Jerby-Arnon et al., 2018; Sade-Feldman et al., 2018), colorectal cancer (Zhang et al., 2018b) (http://crc.cancer-pku.cn/), non-small cell lung cancer (Lambrechts et al., 2018) (https://scope.aertslab.org), and liver cancer (Zheng et al., 2017) (http://hcc.cancer-pku.cn/). In some studies, samples were collected from both malignant tissue and normal, adjacent tissues. We used the sample and cell-type annotations provided by the authors to select only T cells from the malignant tissue samples. In liver cancer and colorectal cancer, 4% and 1% of the T cells, respectively, were MAIT cells (as defined by the dataset authors). For melanoma, colorectal cancer, and liver cancer, we constructed t-distributed stochastic neighbor embedding (t-SNE) visualizations using RunTSNE with perplexity = 30. For lung cancer, we used the t-SNE visualization provided by the authors.
Pan-cancer metanalysis of KLRB1 transcriptional programs
We identified KLRB1 programs by comparing between cells in which KLRB1 was detected (KLRB1+) and cells in which KLRB1 was not detected (KLRB1-). Each KLRB1 program consisted of the genes whose expression was significantly greater in KLRB1+ T cells relative to KLRB1- T cells, and as above, differential expression analysis was performed using a t test on the log-transformed TPM100K values. We identified the KLRB1 programs separately in CD4 and CD8 T cells, using the glioma IDH-G + GBM cohort. We then repeated this analysis in the five other scRNA-Seq T cell datasets listed above. We evaluated the significance of overlap in genes between the programs that were identified in each T cell cohort with a hypergeometric test (Figure 7C). For each pair of programs we also report the observed versus expected ratio (Figure 7D), that is, the number of genes in the overlap between the two programs, divided by the number of genes that are expected to be in the overlap if the programs were randomly sampled. Lastly, to integrate the results that were obtained across the six cohorts in this metanalysis and derive the final pan-cancer program, we used Fisher’s combined probability test and corrected the resulting p values for multiple hypotheses testing using the Benjamini-Hochberg correction. The different programs and the final pan-cancer p values are provided in Table S5. To define the pan-cancer KLRB1 programs in CD4 T cells and in CD8 T cells (Figure 7E), we used those significant genes that appeared in at least 3 of 6 of the KLRB1 programs from the six cancer cohorts, including the glioma IDH-G + GBM cohort.
T cell differences between IDH-G and GBM in bulk RNA-seq profiles from TCGA
To evaluate the differences in T cell expression in a larger dataset, we leveraged the GBM and IDH-G bulk RNA-seq expression profiles from the TCGA. First, we combined the scRNA-seq data with our previously published glioblastoma scRNA-seq data, which were generated using the same protocol, to compare the average expression of each gene across different cell types and identify genes that were at least 8-fold higher expressed in T cells than in any other cell-type. Next, we found the log-transformed expression of each of these T cell specific genes in the bulk RNA seq dataset. Next, we calculated the total T cell signal for each tumor, defined by the average expression of the genes CD2, CD3D, CD3E, and CD3G. Since the state of T cells cannot be properly evaluated if the total T cell signal is low, we restricted further analysis to 129 out of 148 tumors from GBM dataset and 161 out of 428 tumors for the IDH-G dataset that had a total T cell signal above 2. Next, to normalize each gene’s expression in the bulk RNA-seq to its total T cell expression, we generated a relative expression profile for each T cell specific gene, by subtracting from its expression the median expression of all T cell specific genes. Next, to visualize the difference in expression between the GBM and IDH-G tumors, we performed a Student’s t test comparison between the normalized expression (as well as the non-normalized log2-transformed expression) of each T cell specific gene in GBM tumors compared to the IDH-G tumors and plotted the -log10(p value) from this comparison against the log2(fold change) value in a volcano plot.
Figures
Figure 1. Transcriptional features of glioma-infiltrating T cells
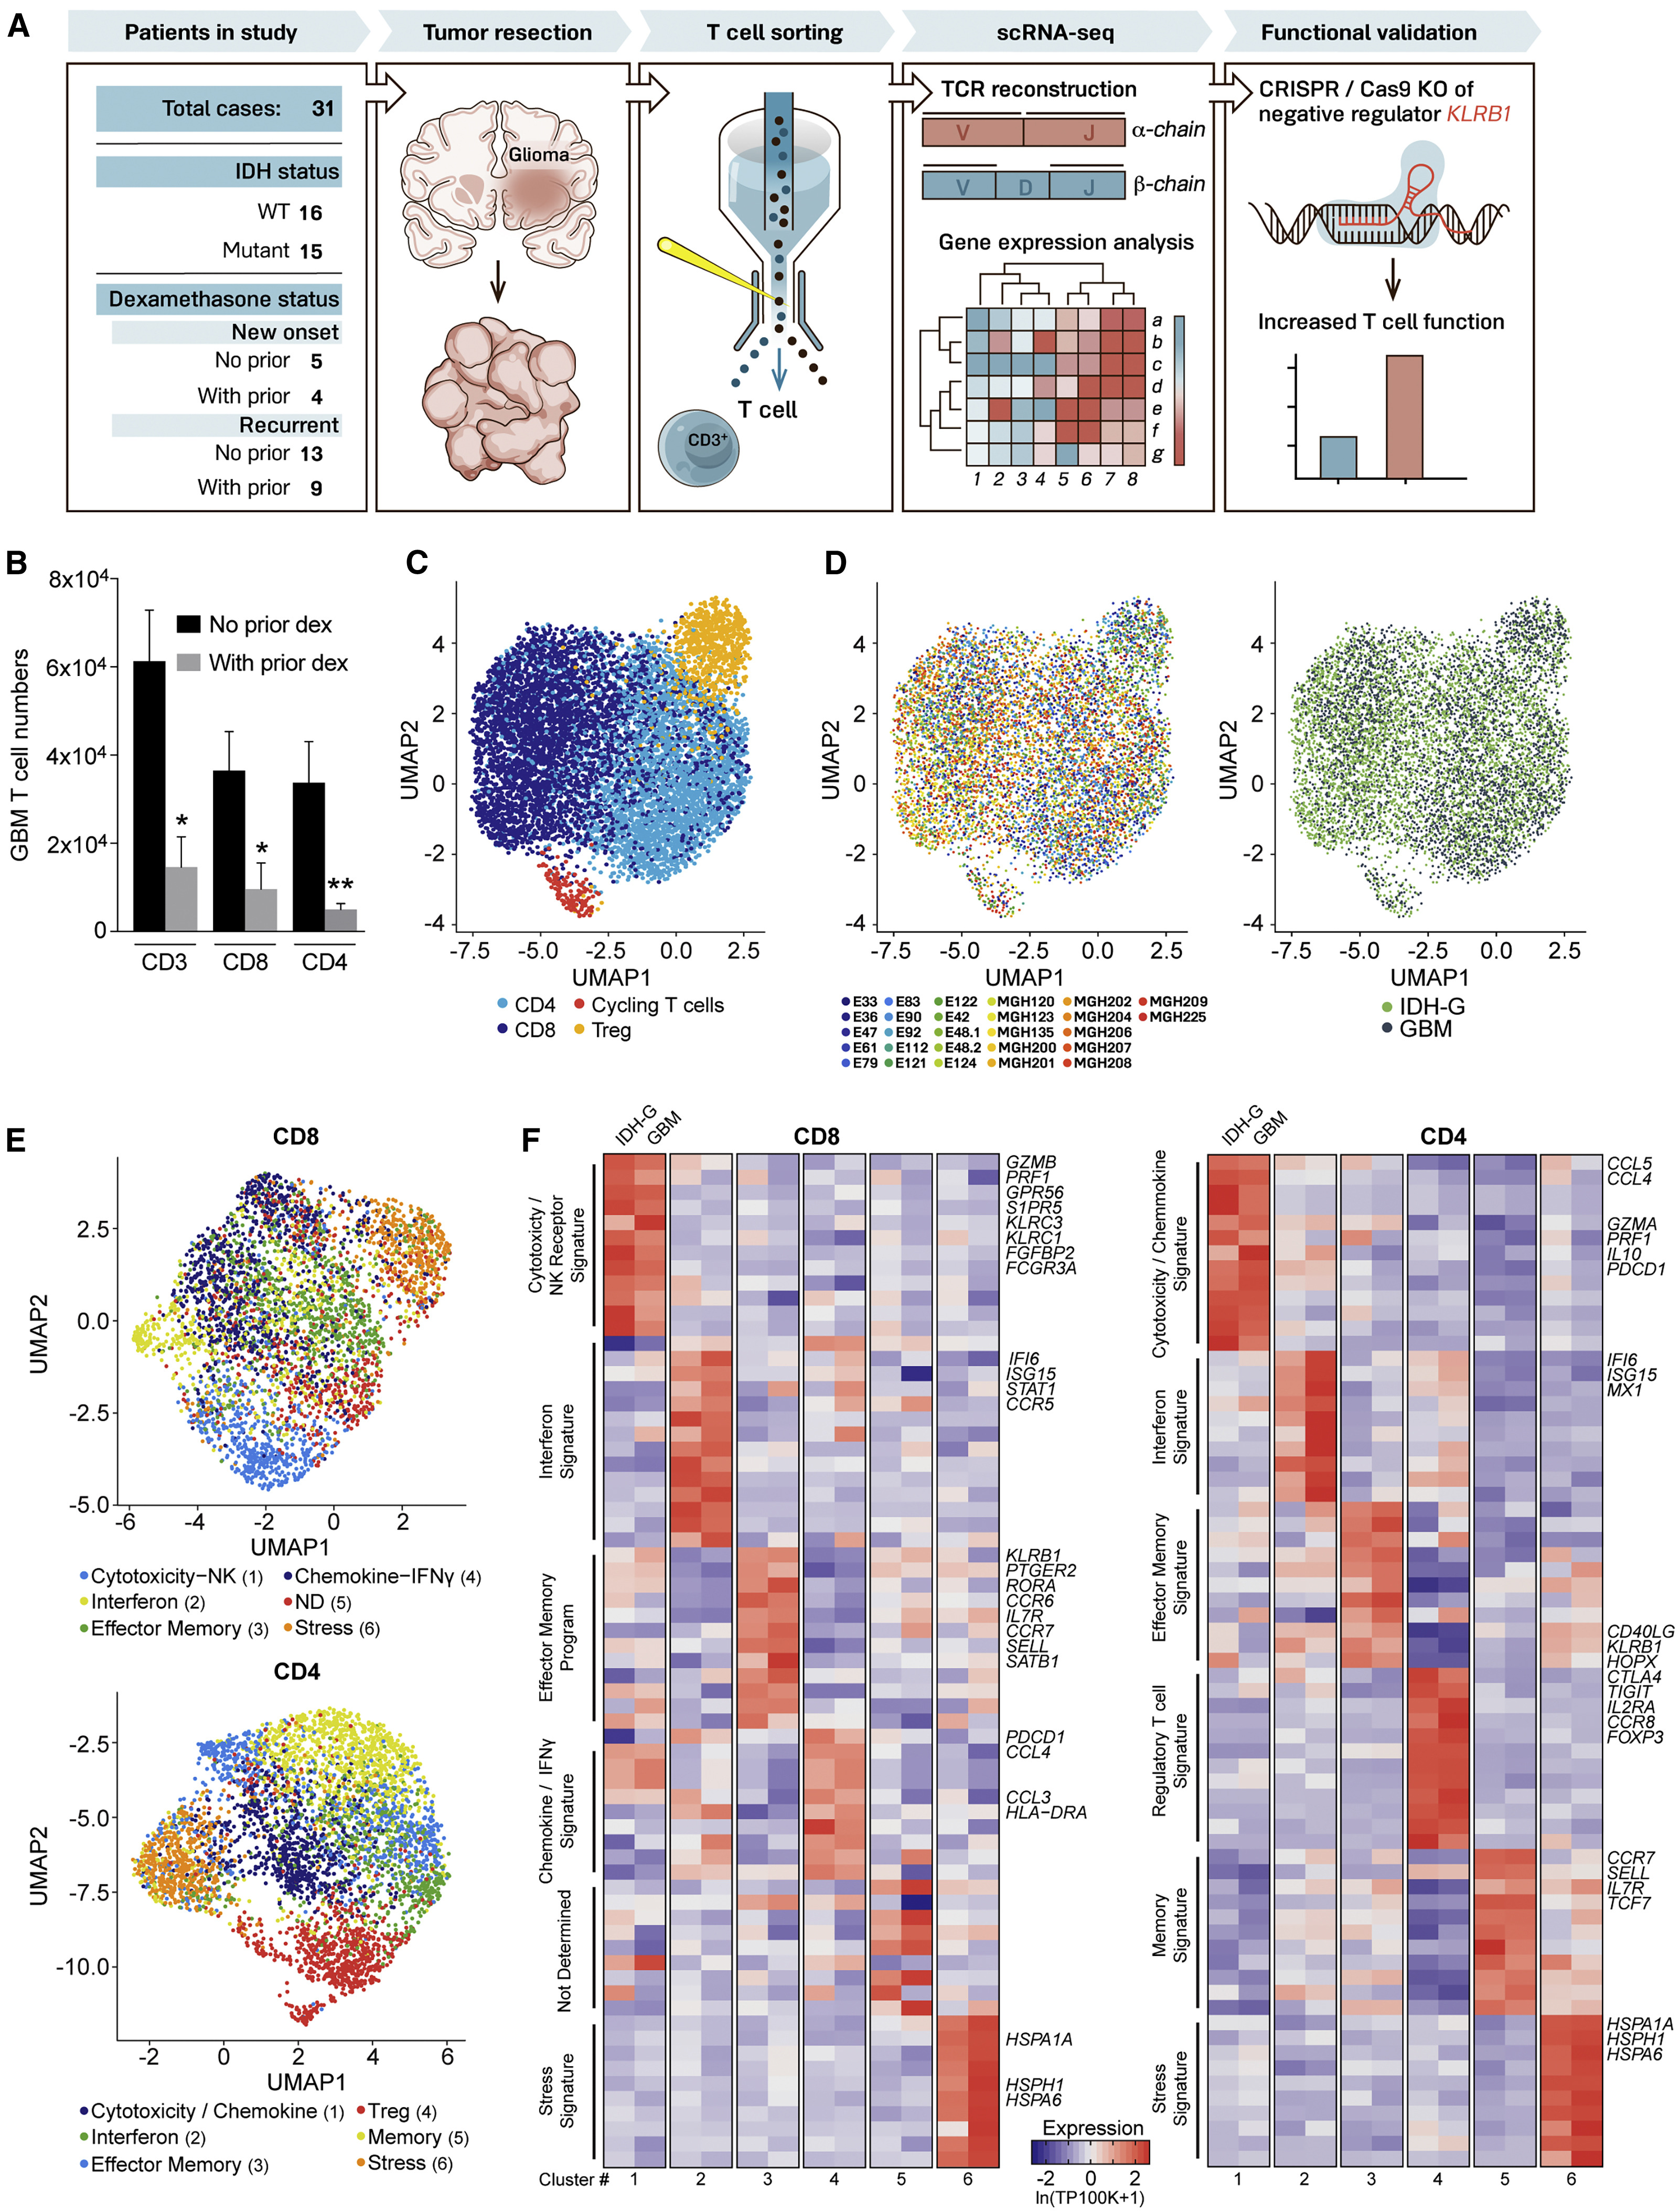
(A) Experimental strategy.
(B) Quantification of GBM infiltrating T cells from patients who did or did not receive prior dexamethasone. ∗p < 0.05, ∗∗p < 0.01 (Mann-Whitney U test). Error bars denote SEM.
(C) Uniform manifold approximation and projection (UMAP) visualization of 8,252 T cells from 26 glioma patients colored by T cell sub-cluster.
(D) UMAP representation from (C) colored based on patient ID (left) and tumor mutational status (right).
(E) Sub-clustering and UMAP visualization of CD8 T cells and CD4 T cells, colored based on NMF clustering; ND, not determined.
(F) Heatmap showing relative expression of selected genes across glioma T cell subsets (clusters numbered at bottom as in E). Gene expression is shown separately for T cells from IDH-G and GBM based on subsets identified using NMF clustering (E). Gene expression is zero-centered and given in units of ln(TP100K+1).
Figure S1. Analysis of glioma-infiltrating T cells

(A) Sorting of T cells from surgical glioma specimens. Single cell suspensions were generated for isolation of T cells by FACS. Individual live T cells were sorted into 96 well plates for scRNA-seq using the SMART-seq2 chemistry. T cells were sorted at two different facilities: T cells from GBM that were processed at DFCI were sorted as CD3+CD4+ and CD3+CD8+ cells; T cells from IDH-G that were processed at MGH were sorted as CD3+ cells. (B) Impact of tissue dissociation procedure on CD8 surface protein levels. Peripheral blood T cells were treated with PBS (left) or tumor dissociation buffer (right) and then analyzed for expression of CD4 and CD8 proteins following gating on live CD45+CD3+ cells. Incubation with the tumor dissociation buffer reduced the staining intensity with the CD8 mAb. (C) Quality-control analysis of scRNA-seq (SMART-seq2) data based on the number of detected genes (top) and housekeeping genes (bottom; dotted line indicates interrogated number of genes) for which transcripts were detected per cell. T cells from patients E88, E119, and MGH142 were excluded from further analysis. (D) UMAP plot with cell annotation based on prior dexamethasone (left) or immune checkpoint inhibitor (ICI) treatment (right). (E) Fraction of T cells assigned to the indicated T cell clusters based on glioma subtype (GBM or IDH-G) and prior treatment (dexamethasone, left; immune checkpoint inhibitor, right). (F) Fraction of T cells assigned to CD8 T cell, CD4 T cell, Treg, and cycling T cell clusters based on tumor type (IDH-G, GBM) and disease state (new onset versus recurrent). (G) Quantification of each tumor for CD8 T cell, CD4 T cell, regulatory T cell (Treg), and cycling T cell clusters; higher frequency of CD8 T cells in IDH-G versus GBM may be related to differences in details of cell isolation procedures as described in (A). (H) RNA-ISH for mRNA expression of three different cellular stress genes (HSPA1A, HSPH1, HSPA6) by CD3E+ T cells; labeling is shown for IDH-G (top) and GBM (bottom).
Figure S2. Transcriptional signatures of glioma-infiltrating T cells
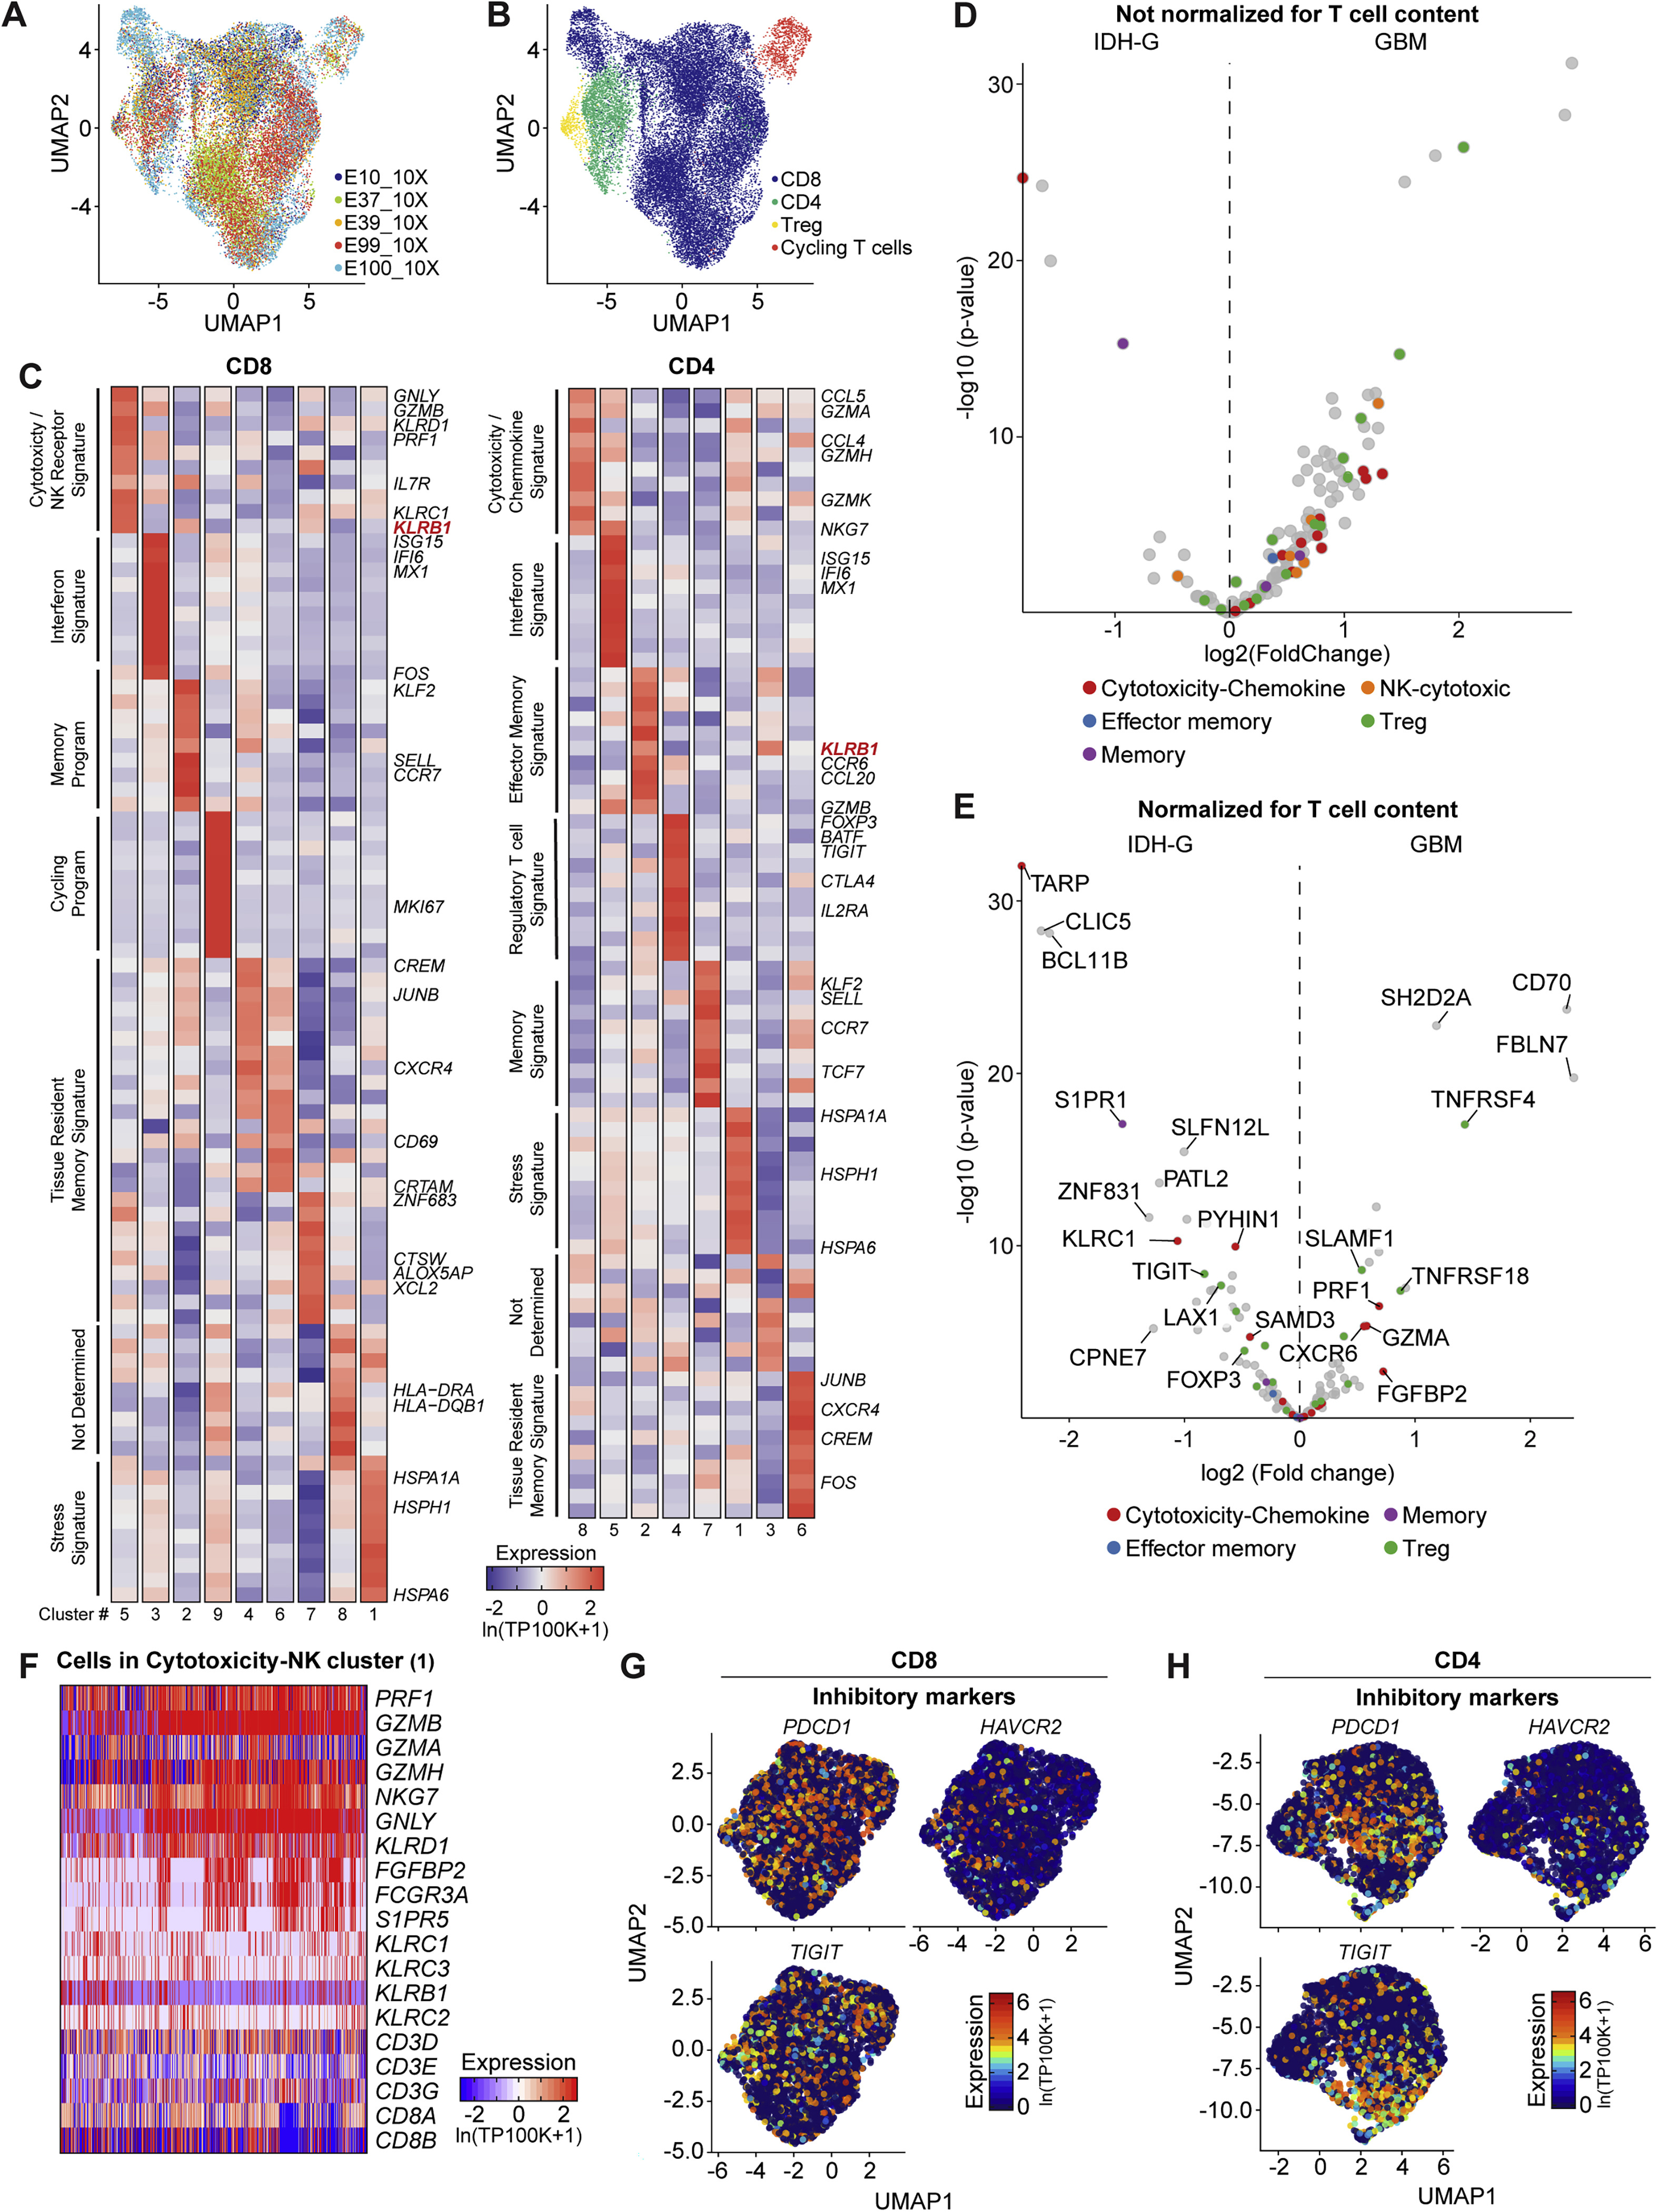
(A-C) scRNA-seq analysis of T cells from five GBM samples by 5′ sequencing using the 10X Genomics platform. (A) UMAP visualization of T cells color-coded based on tumor specimen. (B) UMAP visualization of major T cell subpopulations. (C) Heatmap showing top differentially expressed genes for clusters of CD8 (left) and CD4 (right) T cells. Similar cluster designation is shown as in Figure 1F for T cells from the SMART-seq2 dataset. (D-E) Analysis of TCGA datasets from GBM and IDH-G for expression of T cell specific genes. T cell-specific genes were identified using T cell scRNA-seq data from this study and our previously published GBM scRNA-seq data (Neftel et al., 2019). These genes were used to interrogate bulk RNA-seq data from TCGA, limiting the analysis to those gliomas with a sufficient T cell signal (129 of 148 GBM and 161 of 428 IDH-G samples). Expression of these genes is shown without (D) and with (E) normalization of the total T cell signal (average expression of CD2, CD3D, CD3E, and CD3G). Volcano plots compare expression of these genes in IDH-G (left) versus GBM (right); genes are color coded with respect to T cell cluster in scRNA-seq data (Figure 1E). (F) Heatmap showing relative expression of selected genes across CD8 T cells in cytotoxicity-NK (1) cluster (Figure 1E), with emphasis on key cytotoxicity, NK cell receptor, and T cell markers. Gene expression is zero-centered and given in units of ln(TP100K+1). (G, H) Expression of inhibitory receptor genes (PDCD1, HAVCR2 and TIGIT) in CD8 (G) and CD4 (H) T cells.
Figure 2. Expression of NK cell receptors by population of CD8 T cells
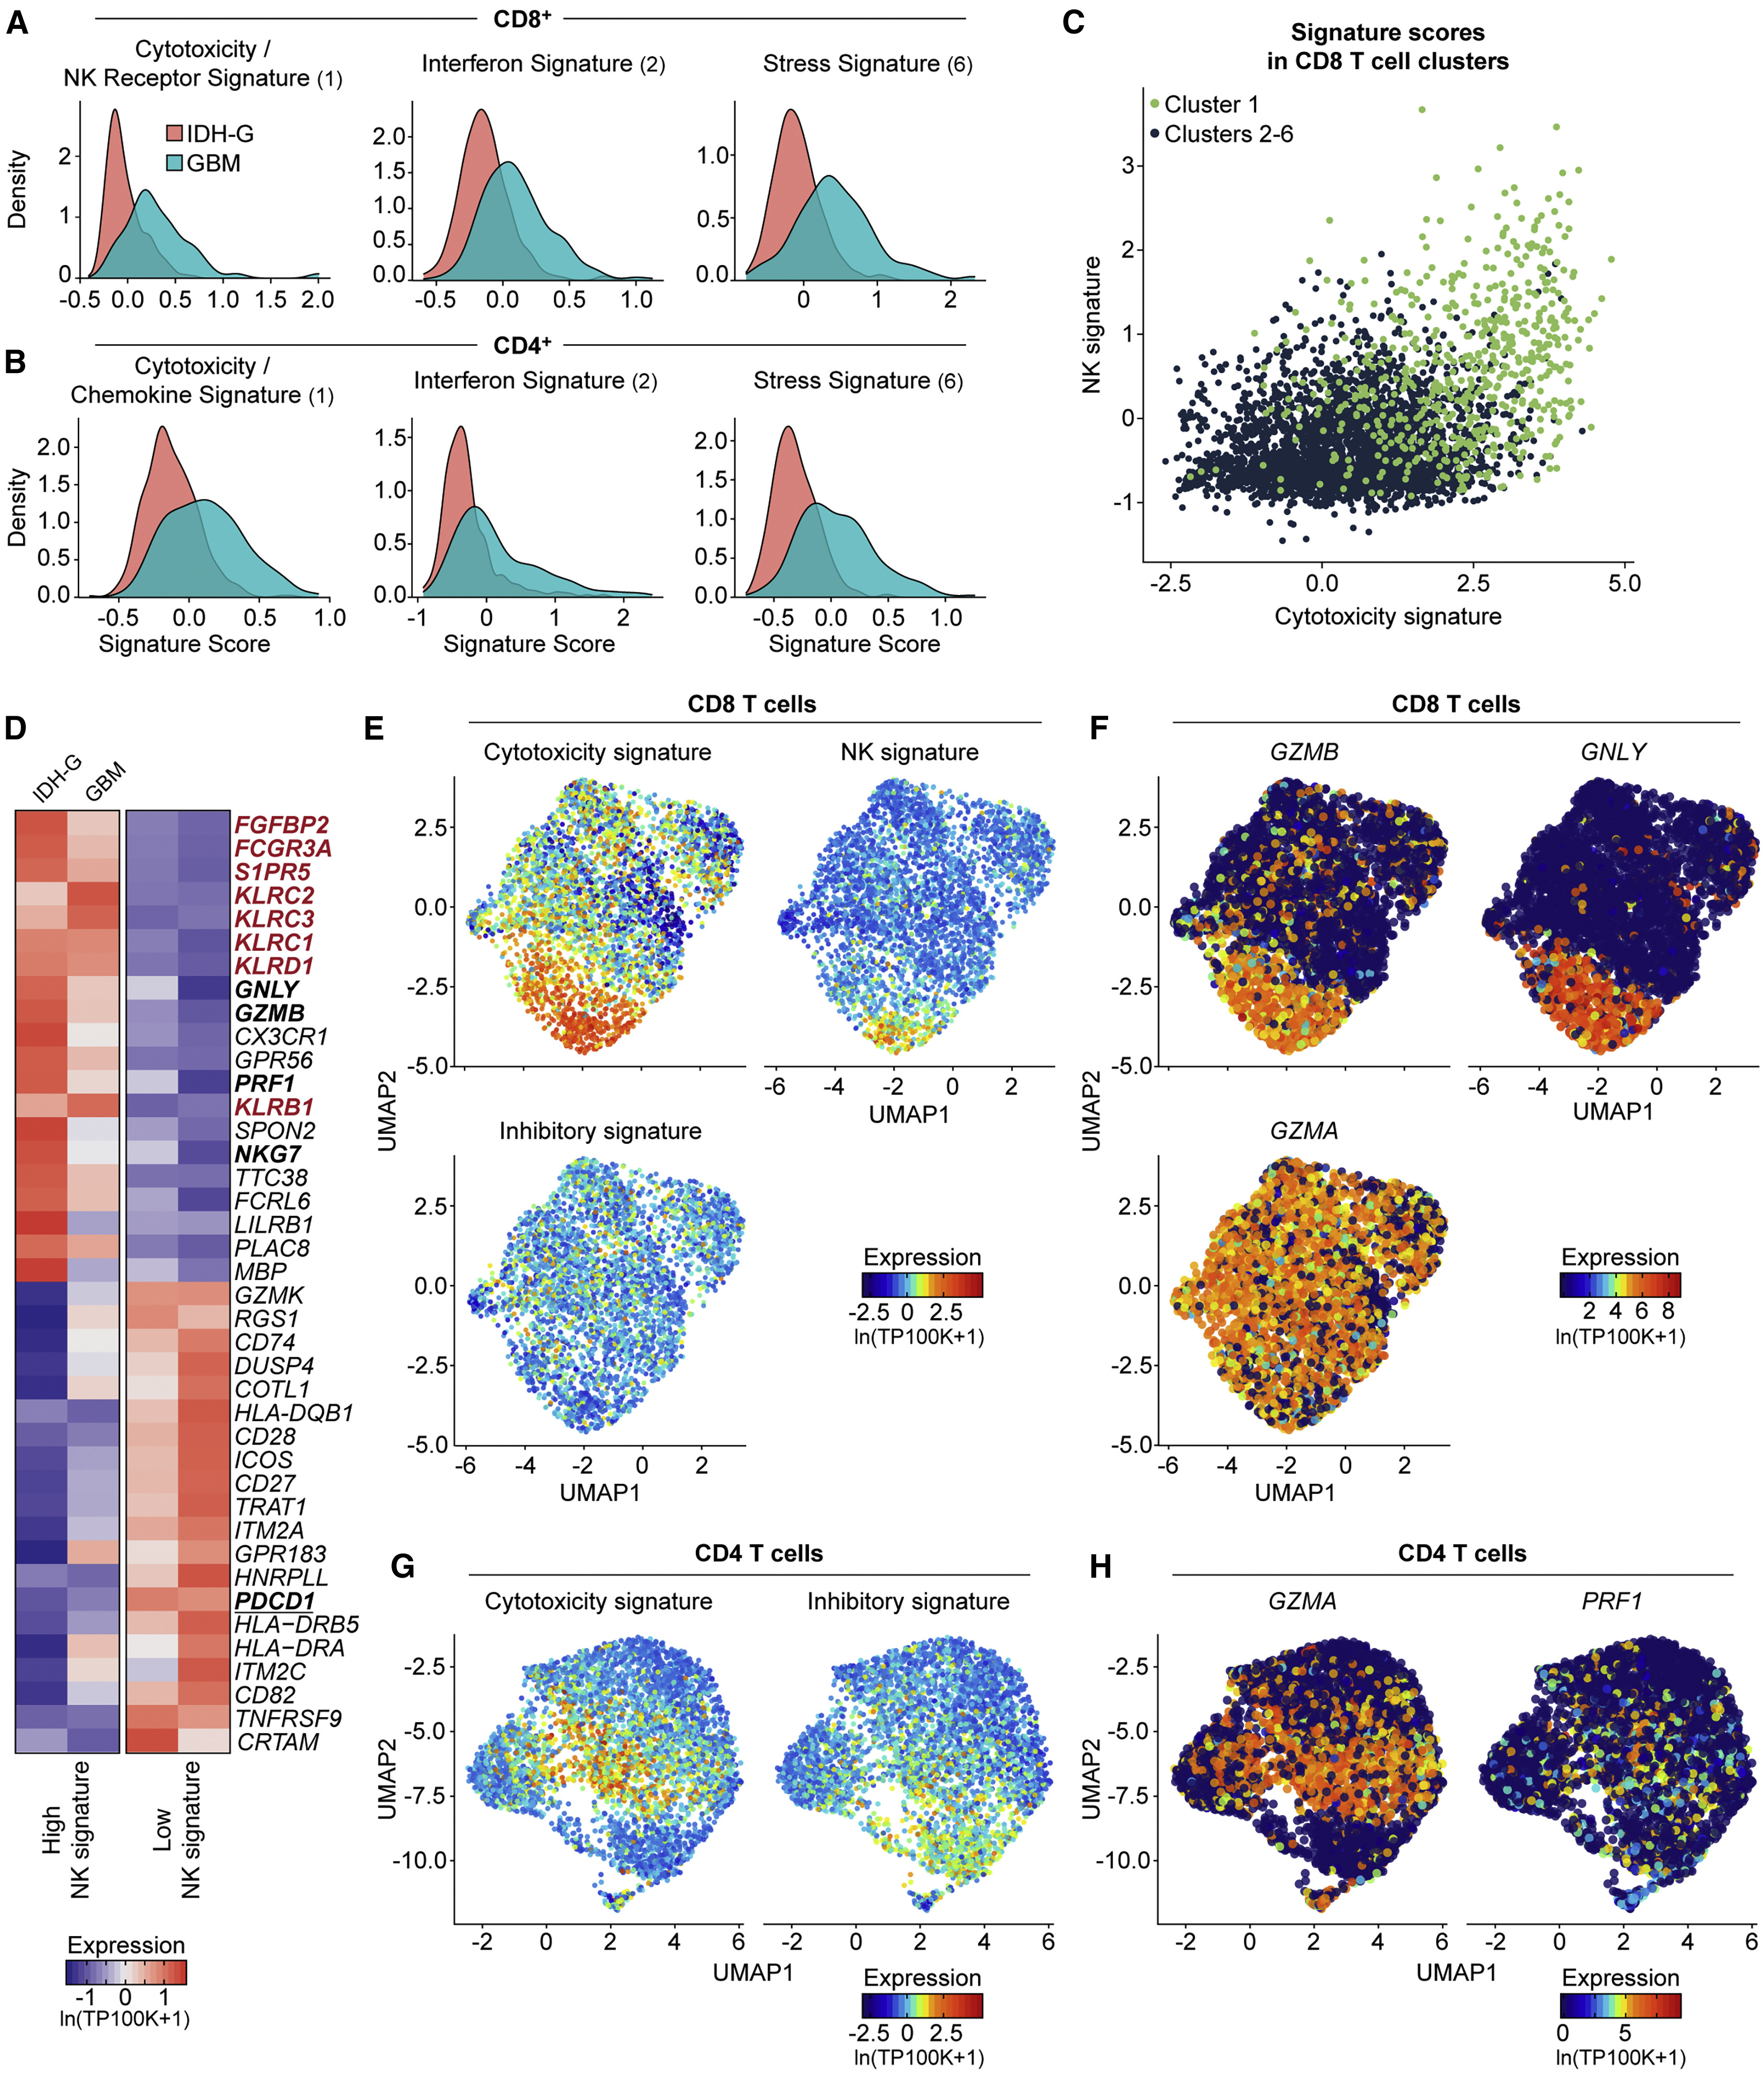
(A and B) Expression of gene signatures for cytotoxicity (CD8: p < 2.2 × 10¹⁶; CD4: p = 1.52 × 10¹³), interferon (CD8: p < 2.2 × 10¹⁶; CD4: p < 2.2 × 10¹⁶) and stress (CD8: p < 2.2 × 10¹⁶; CD4: p < 2.2 × 10¹⁶) are elevated in their respective sub-clusters for GBM compared to IDH-G in both CD8 (A) and CD4 (B) T cells (Kolmogorov-Smirnov two-sample test); cluster designation corresponds to Figures 1E and 1F.
(C) Correlation of cytotoxicity signature (x axis) and NK signature scores (y axis) for CD8 T cells from cluster 1 (green) or other clusters (2–6, black); clusters as defined in Figure 1E (STAR methods).
(D) CD8 T cells from all gliomas were split into those with high and low NK signature scores. Heatmap shows relative expression of the 20 most differentially expressed genes for each subset, separately for IDH-G and GBM. NK signature genes are bolded red, cytotoxicity signature genes are bolded black.
(E) UMAP visualization of CD8 T cells colored by expression of cytotoxicity, NK receptor, or inhibitory receptor signatures (STAR methods).
(F) Expression of three cytotoxicity markers in CD8 T cells.
(G) UMAP visualization of CD4 T cells colored by expression of cytotoxicity or inhibitory receptor signatures.
(H) Cytotoxic markers in CD4 T cells. (E–H) Displayed on UMAP visualizations as in Figure 1E. Gene expression is given in units of ln(TP100K+1).
Figure 3. Transcriptional signatures of clonally expanded T cells
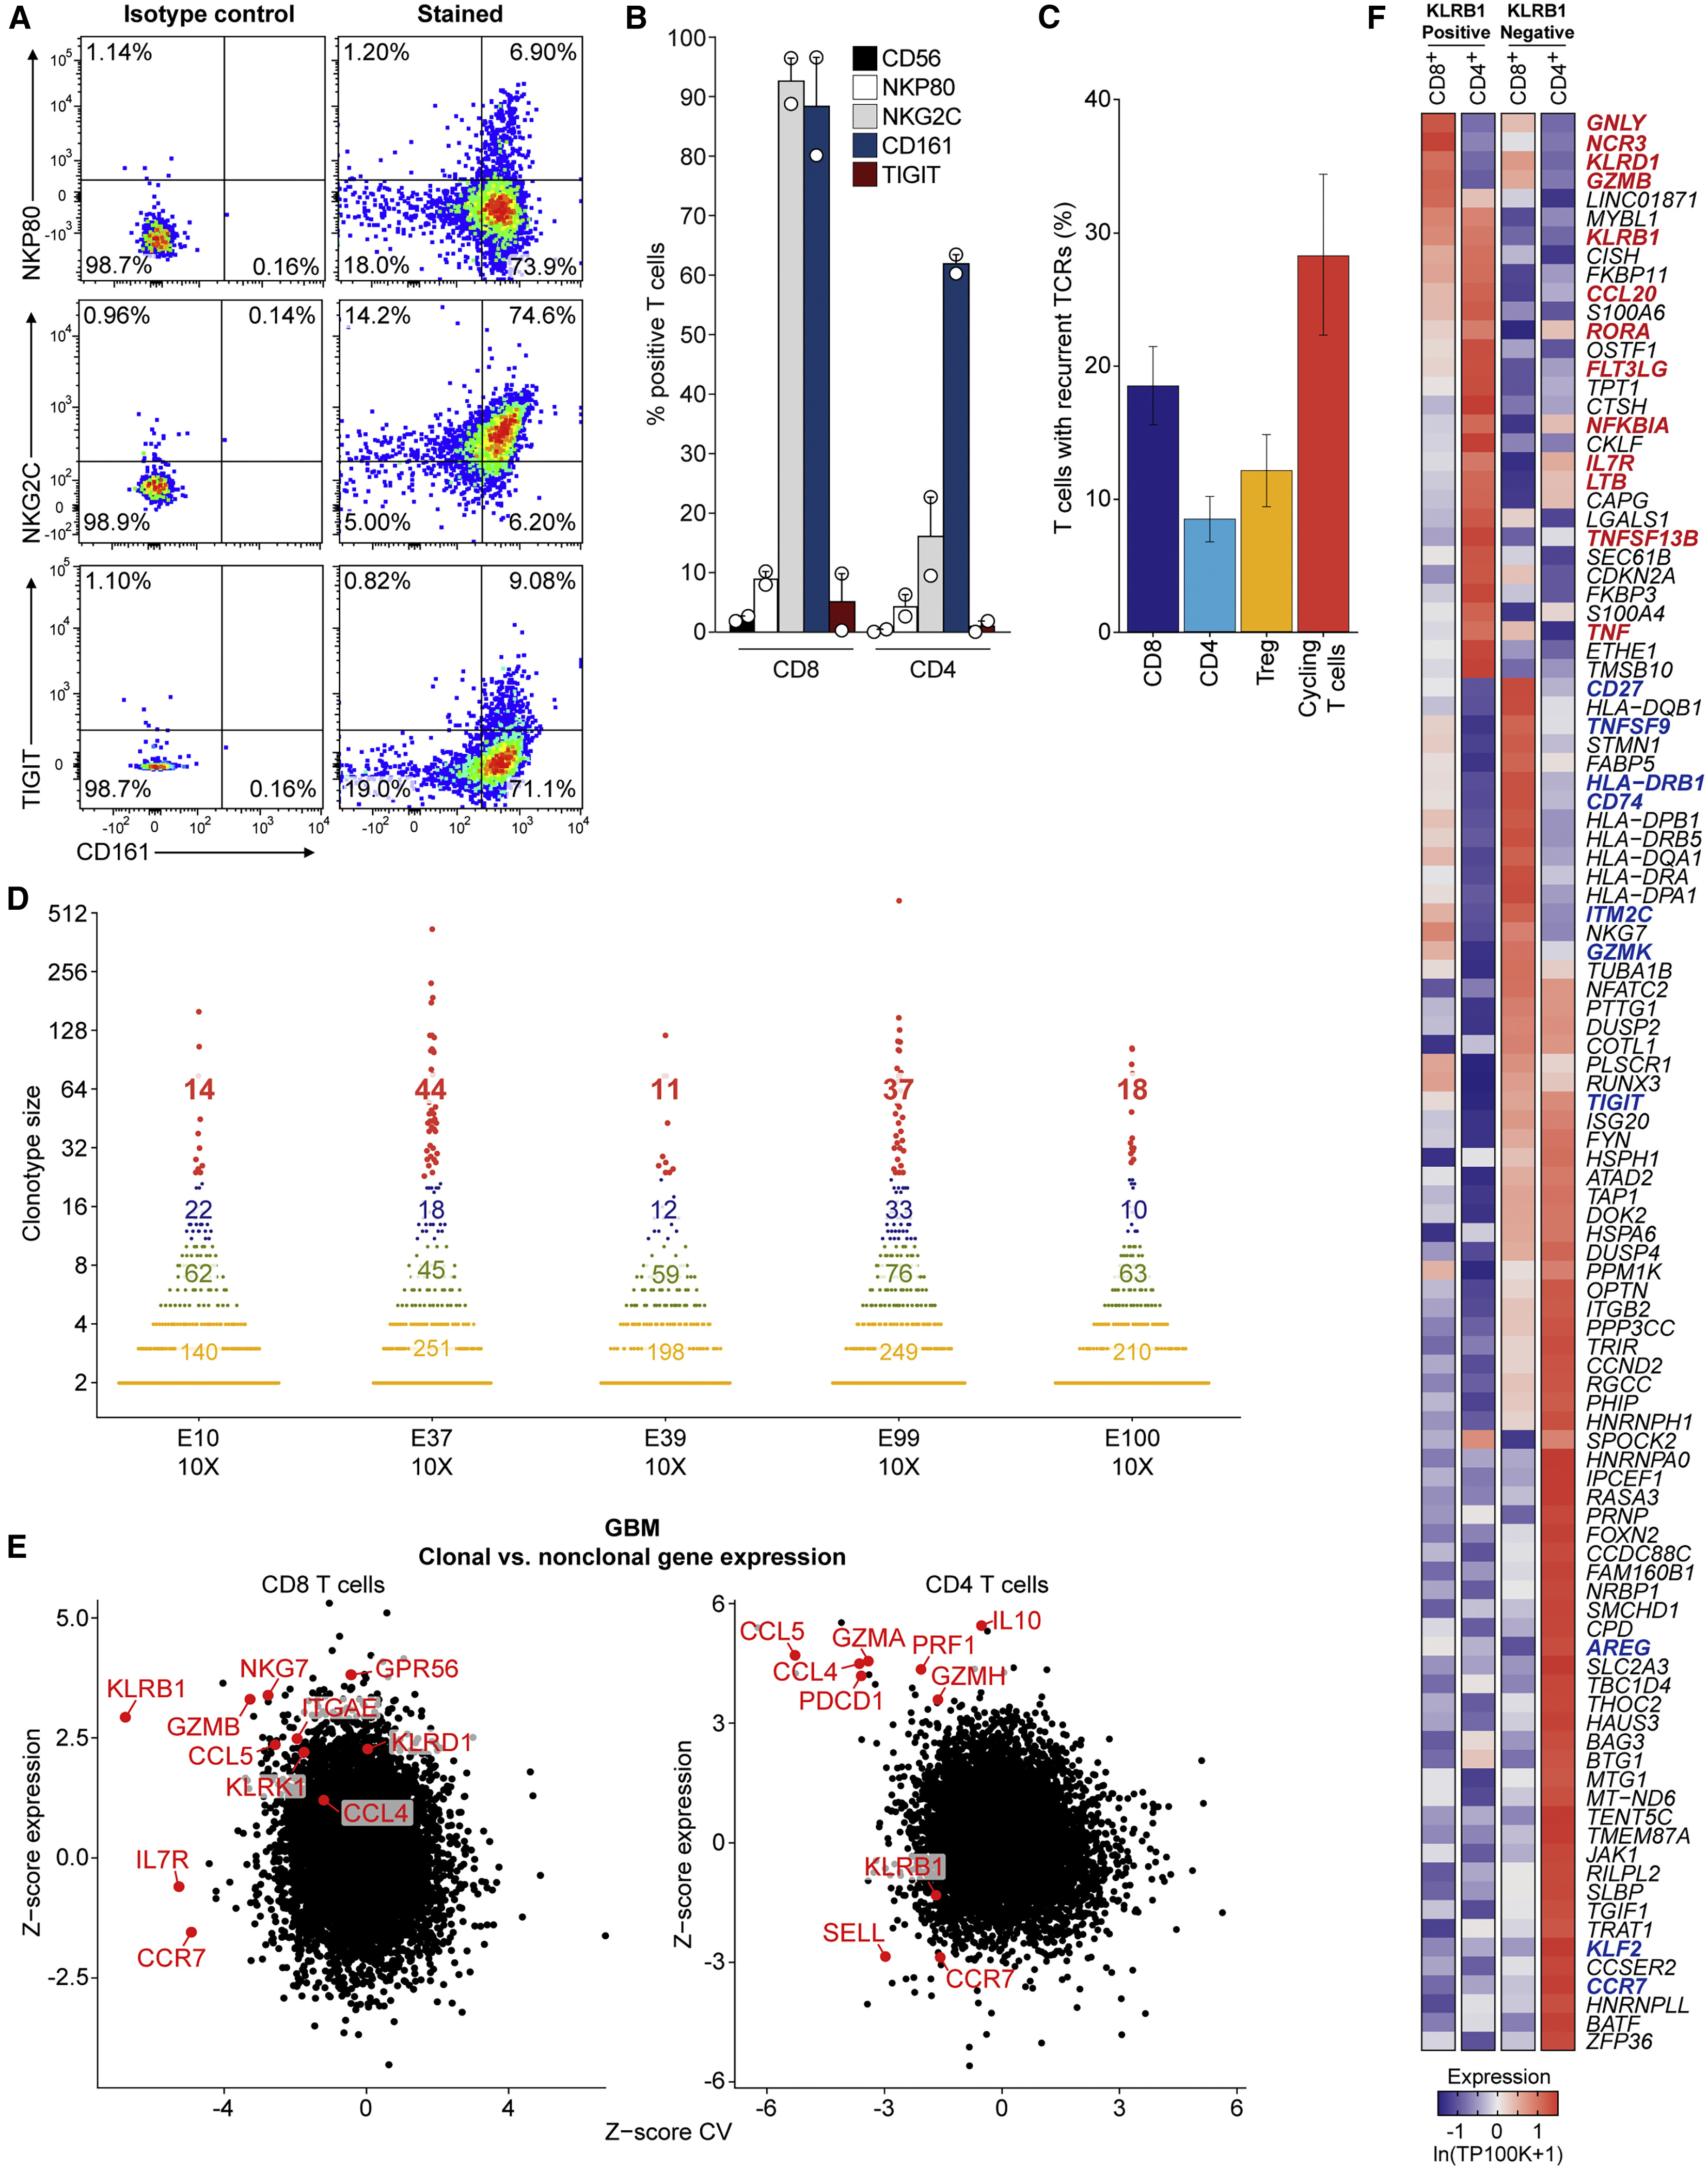
(A) Flow cytometric analysis of GBM-infiltrating CD8 T cells from one patient for protein levels of CD161 (x axis), NKp80, NKG2C, and TIGIT (y axis).
(B) Summary of data from (A) for tumor-infiltrating T cells from two GBM patients. Error bars denote SEM.
(C) TCR α and β chain sequences were reconstructed for each cell from scRNA-seq reads for the full-length scRNA-seq dataset and displayed as mean percent of T cells with recurrent TCRs within each T cell subset. The mean percent is taken across all individual patient samples and the error bars show the SEM.
(D) Size of TCR clonotypes for five GBM samples based on 5′ scRNA-seq analysis. Clonotype sizes are grouped by colors, and the number of clonotypes for each size group is indicated for each tumor.
(E) Comparison of expression for each gene in clonal versus non-clonal T cells from GBM tumors. Z score of expression (y axis) and Z score of coefficient of variation (CV) of expression (x axis) is shown for each gene separately for CD8 (left) and CD4 (right) T cells (STAR methods).
(F) Heatmap comparing gene expression of clonally expanded, KLRB1-positive and -negative T cells from five GBM samples based on 5′ scRNA-seq analysis. Gene expression is zero-centered and given in units of ln(TP100K+1).
Figure S3. Transcriptional programs of clonally expanded T cells
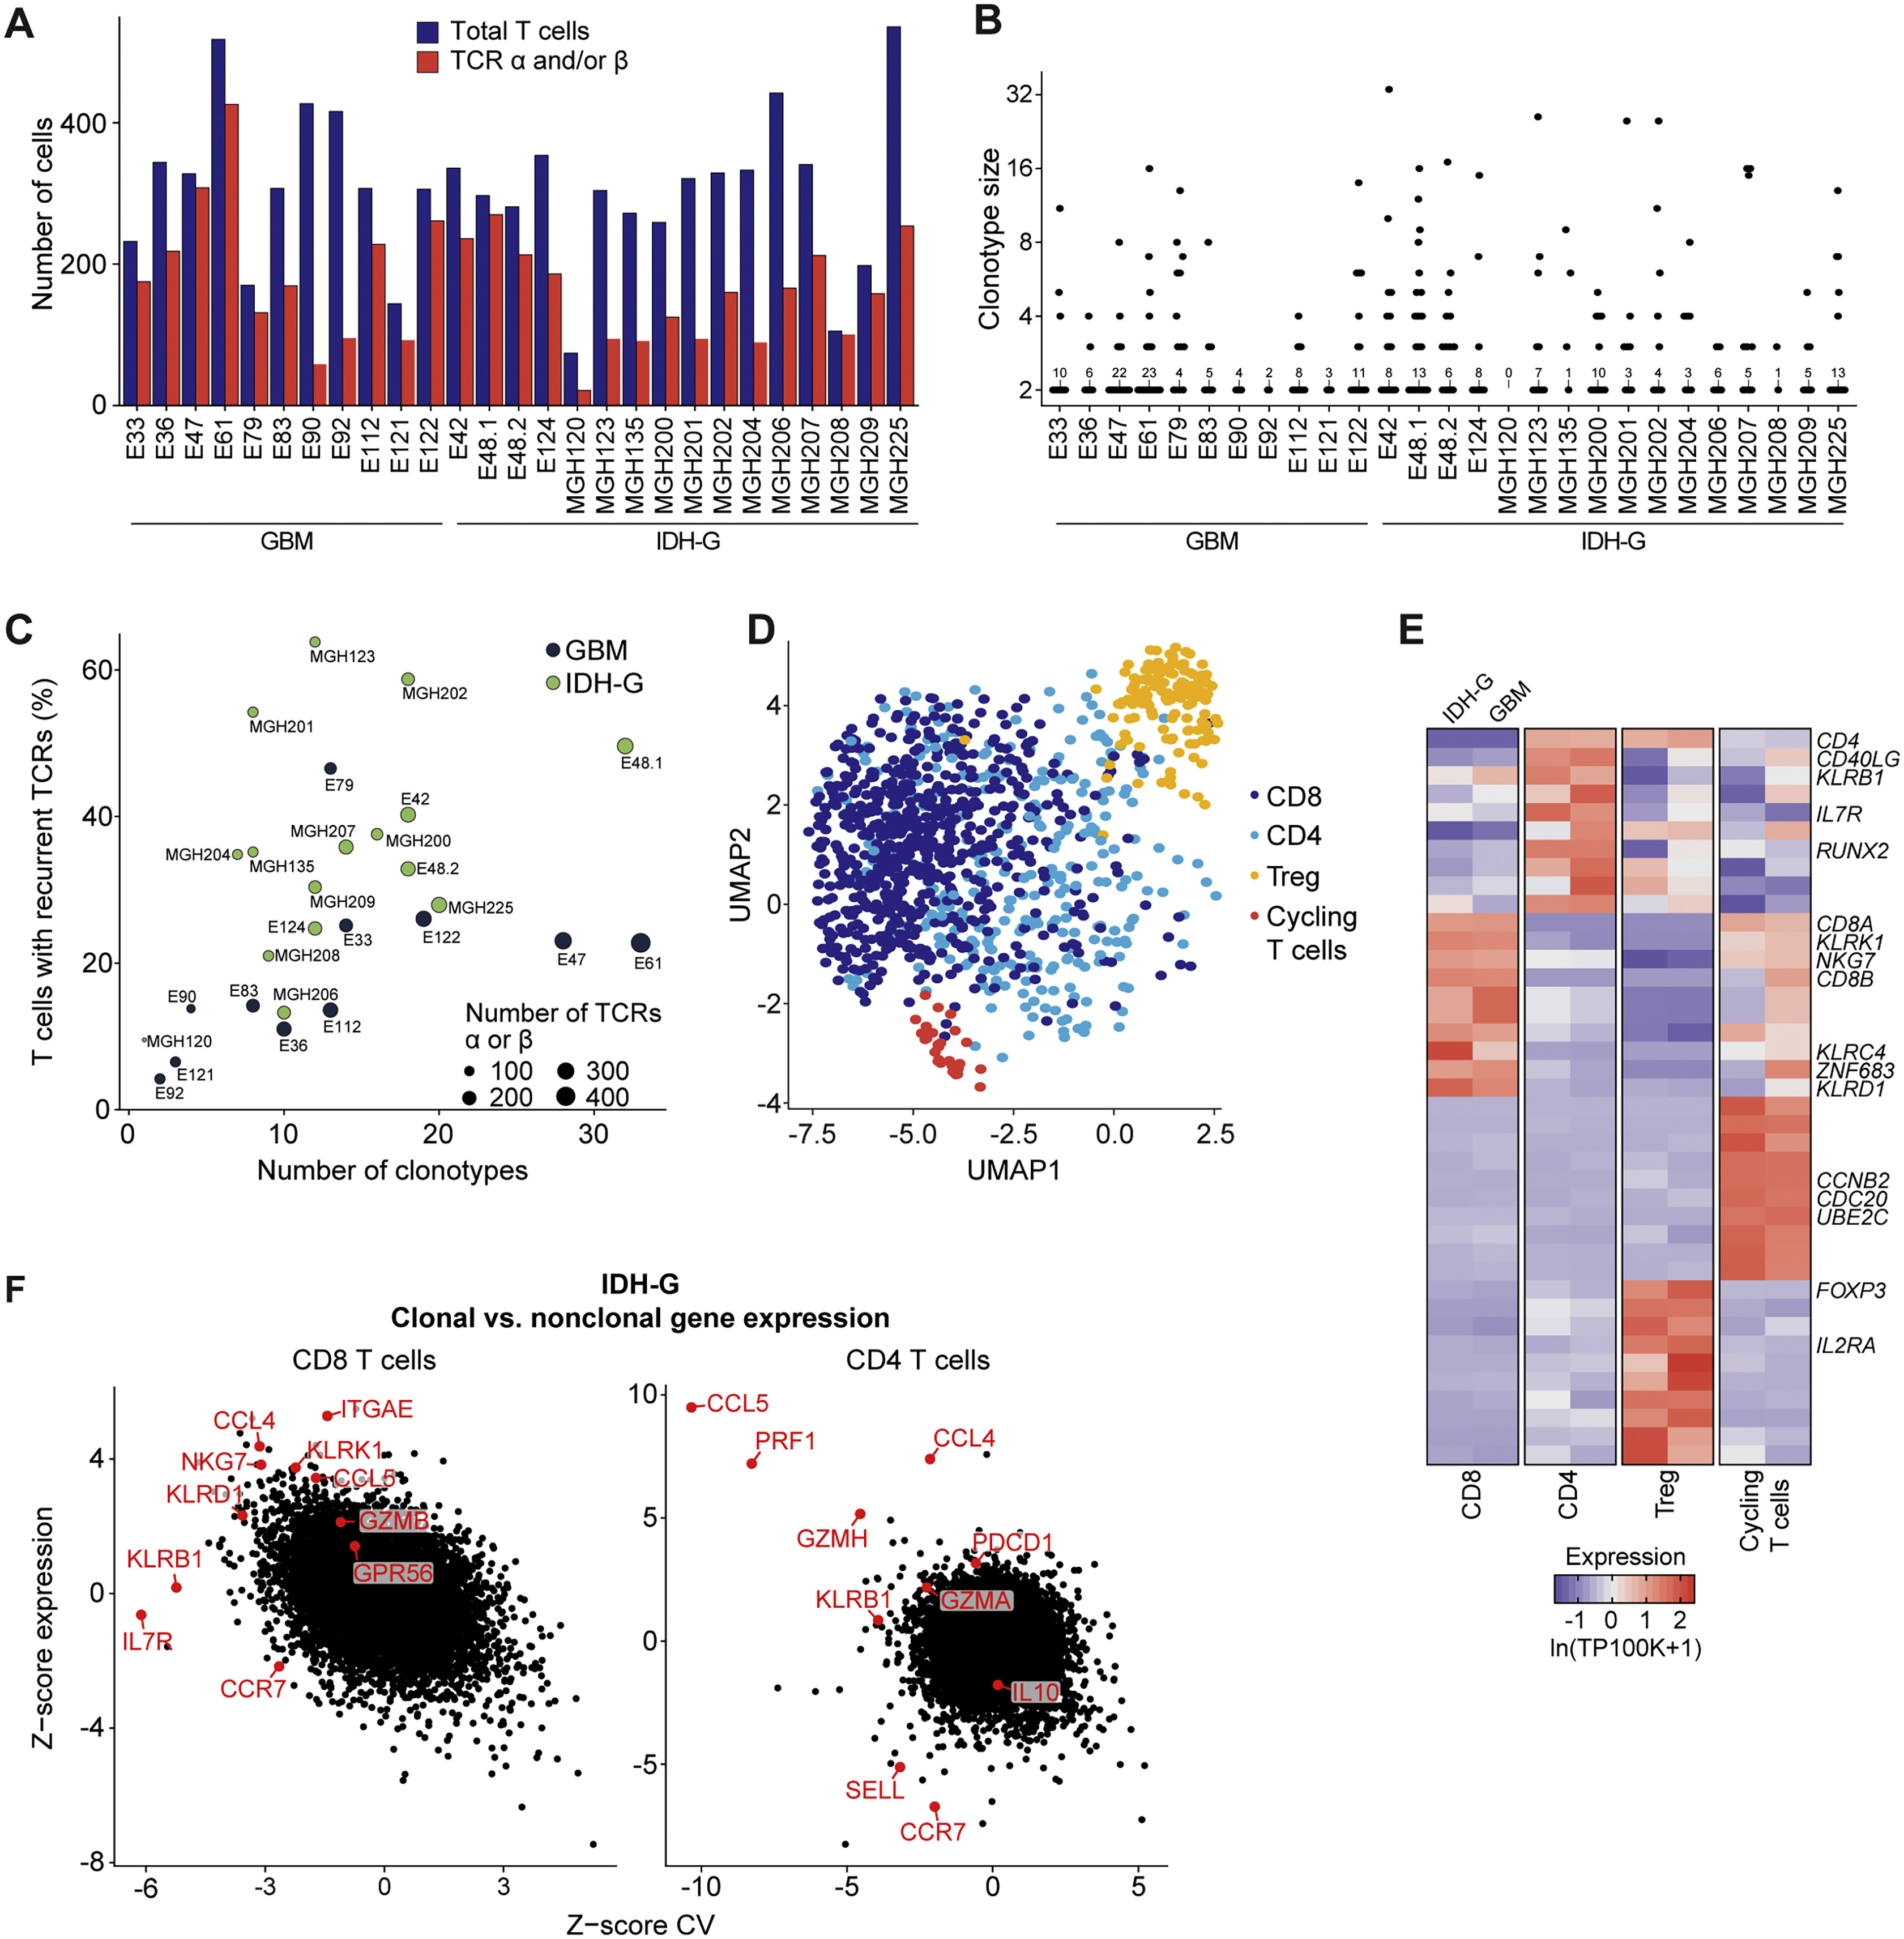
(A-F) Analysis of gene expression in clonally expanded T cells using the SMART-seq2 dataset. (A) Number of T cells from each patient passing quality control and number of those cells with reconstructed TCR α and/or β chains. (B) Quantification of clonally expanded T cells in each patient’s tumor. TCR sequences were used to identify T cells with identical TCR sequences (clonotypes). For each patient tumor, the number of T cells belonging to each clonotype (clonotype size) is shown; the number of clonotypes composed of two T cells is also indicated. (C) Percentage of T cells from each patient that shared a TCR chain with another T cell (recurrent TCRs) (y axis) and the number of distinct identified T cell clonotypes per patient (x axis). GBM shown in dark black and IDH-G shown in light green. (D) UMAP visualization of T cells with recurrent TCRs colored by subsets. (E) Heatmap showing relative expression of selected cluster-related marker genes across subsets of clonally expanded T cells defined in (D). The gliomas are separated into IDH-G and GBM. Gene expression is zero-centered and given in units of ln(TP100K+1). (F) Comparison of expression for each gene in clonal versus non-clonal T cells in IDH-G. Z-score of gene expression (y axis) and Z-score of the coefficient of variation (CV; x axis) of gene expression is shown separately for each gene in CD8 (left) and CD4 (right) T cells.
Figure 4. Investigation of CLEC2D-CD161 pathway in GBM
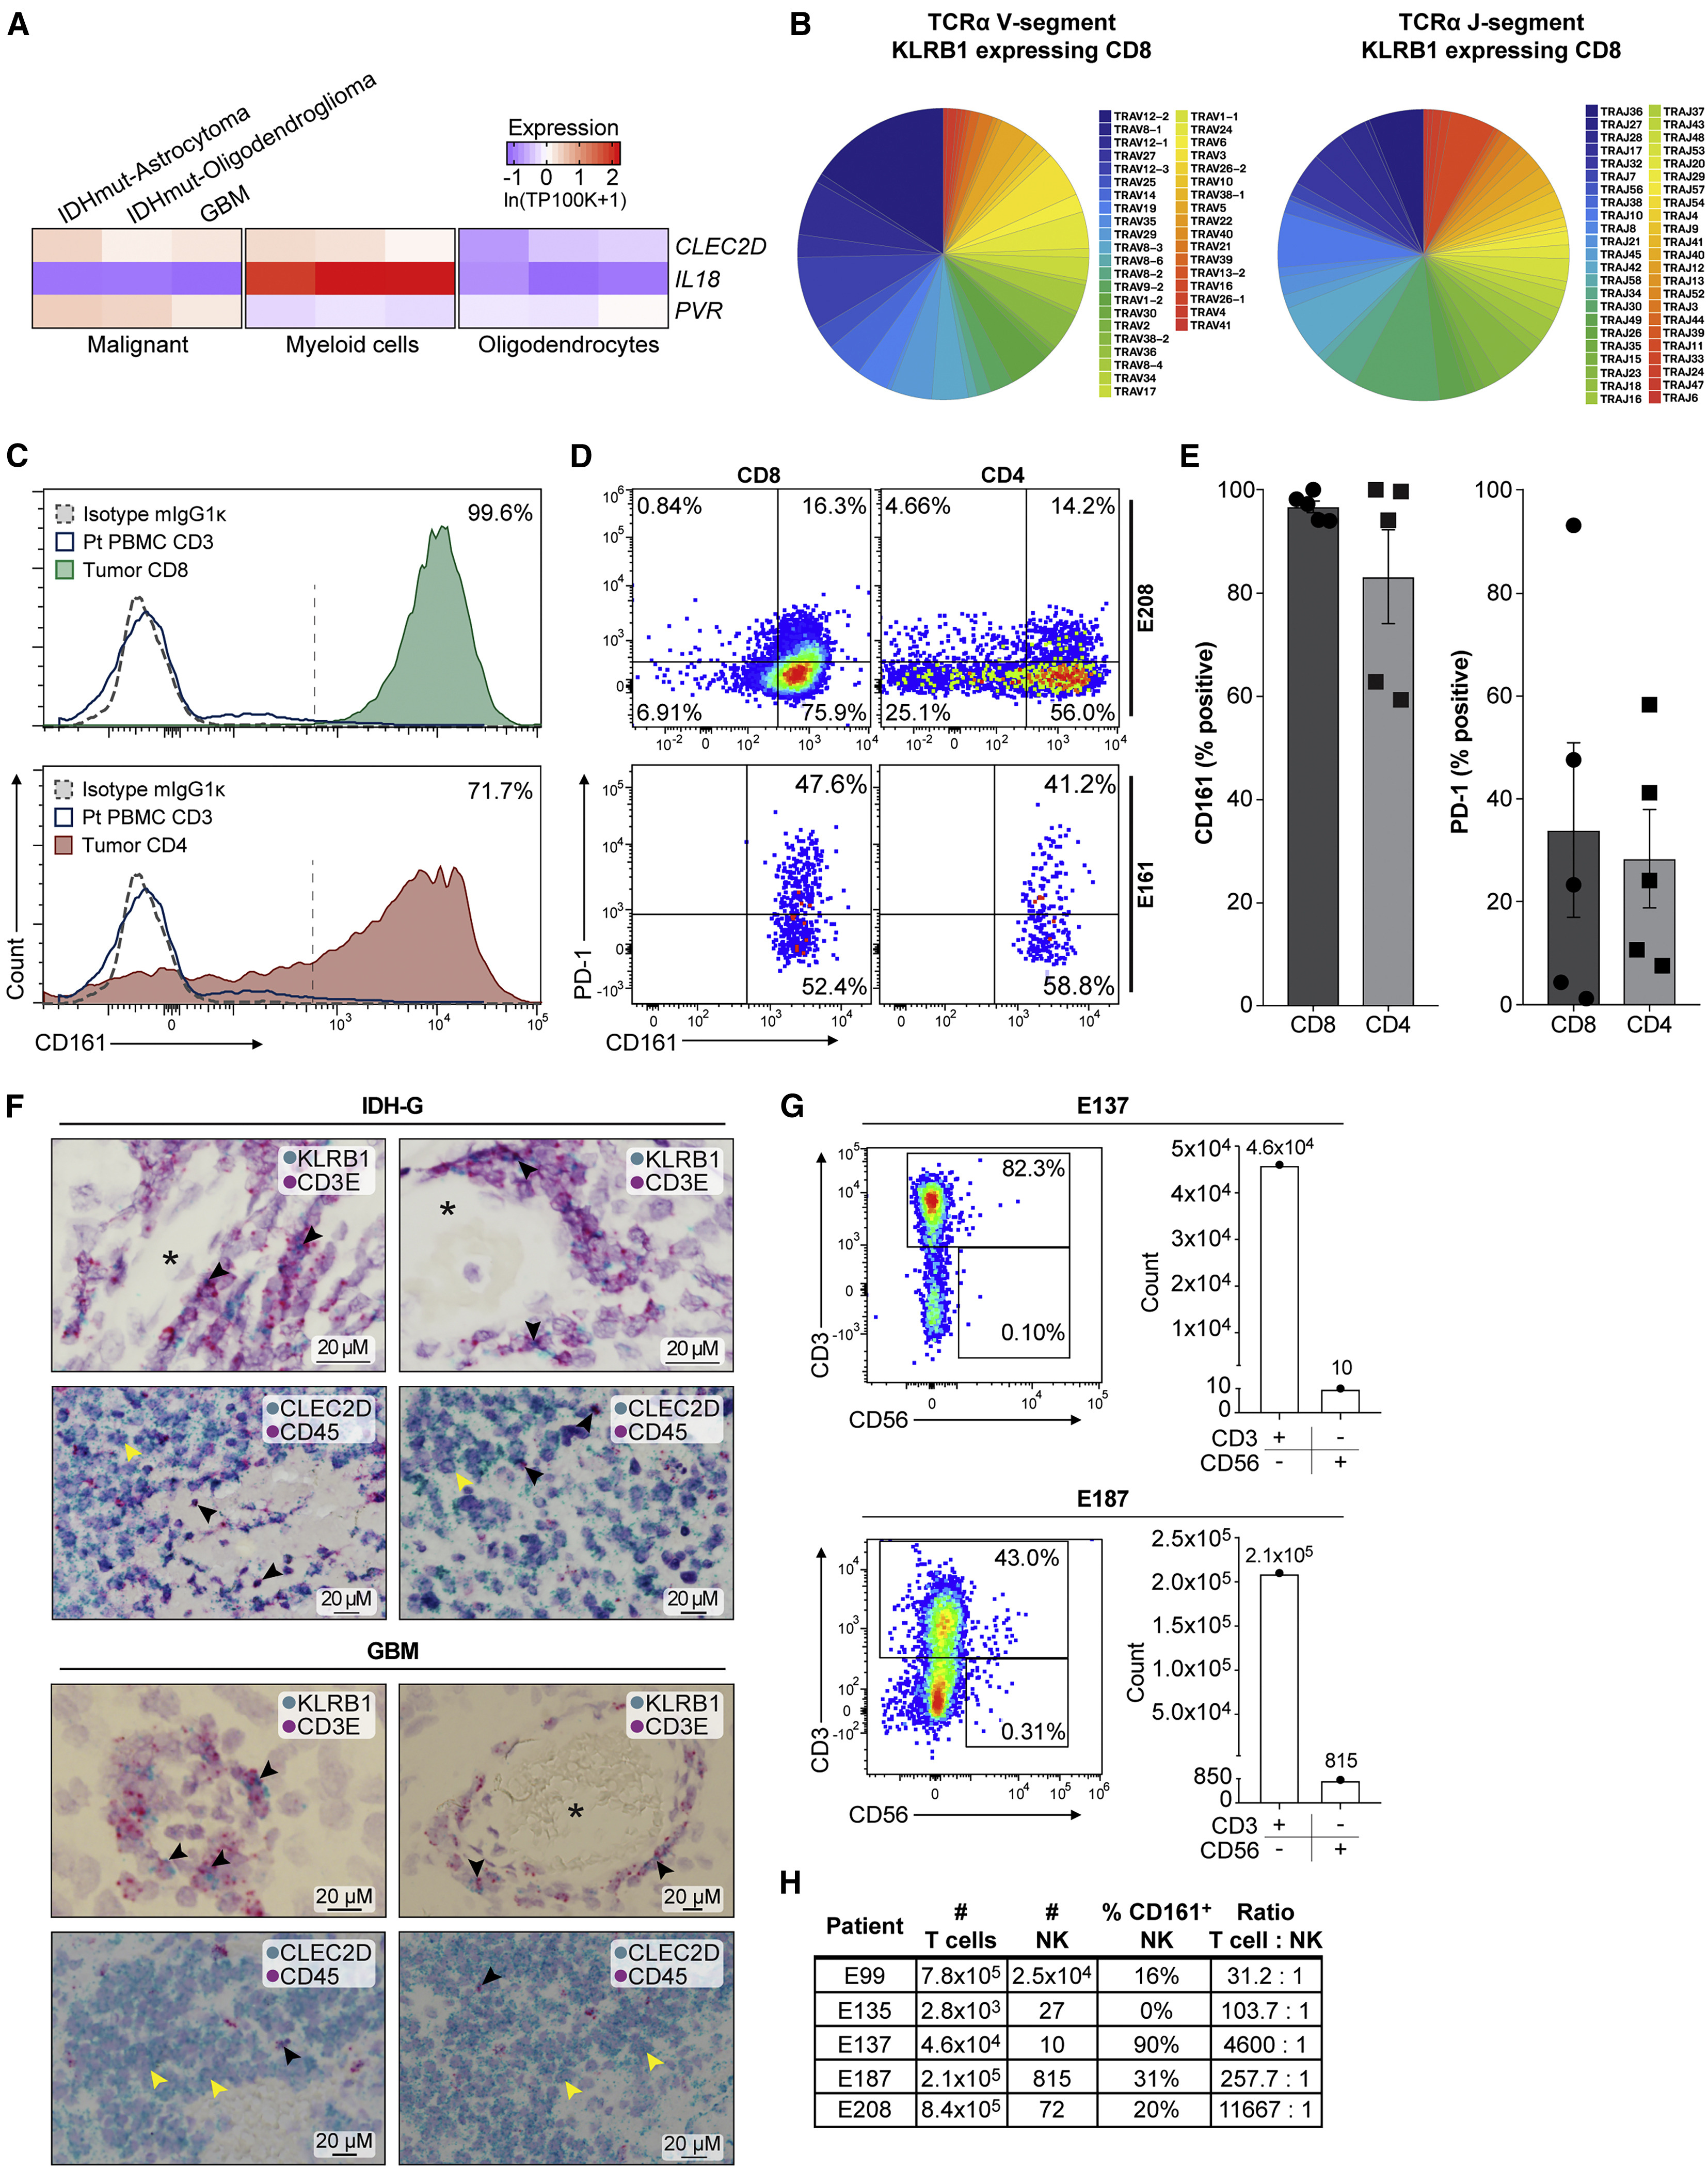
(A) Quantification of transcript levels for CLEC2D and selected genes in malignant cells, myeloid cells, and oligodendrocytes from published glioma datasets. Gene expression is zero-centered and given in units of ln(TP100K+1).
(B) Diversity of TCRα V and J gene segment usage by CD8 T cells expressing KLRB1.
(C) Flow cytometric analysis of CD161 protein on the surface of CD8 (top) and CD4 (bottom) T cells in GBM (filled colors) versus blood T cells (blue line) from the same patient. Dotted line indicates staining with isotype control antibody; percentage of CD161+ tumor-infiltrating T cells is indicated.
(D and E) Quantification of CD161- and PD-1-positive T cells in two GBM (E208 and E161), based on fluorescence minus one (FMO) and isotype controls, (D) and summary of data for five GBM (E). Percentage of CD161- versus PD-1-positive T cells, p < 0.006 for CD8 and p < 0.003 for CD4 T cells, Mann-Whitney U test. Error bars denote SEM.
(F) In situ hybridization in two IDH-G (upper panel) and two GBM (lower panel) with probes for KLRB1 and CD3E (top) as well as CLEC2D and CD45 (bottom), counterstained with hematoxylin (light purple). Top row shows subsets of cells co-expressing CD3E and KLRB1 (black arrowheads); bottom row highlights CLEC2D expression in malignant cells (yellow arrowheads) and CD45 positive immune cells (black arrowheads); ∗lumen of blood vessels.
(G and H) Quantification of infiltrating CD3+ T cells and CD3-CD56+ NK cells in five GBM.
Figure S4. Expression of KLRB1 in glioma-infiltrating T cells
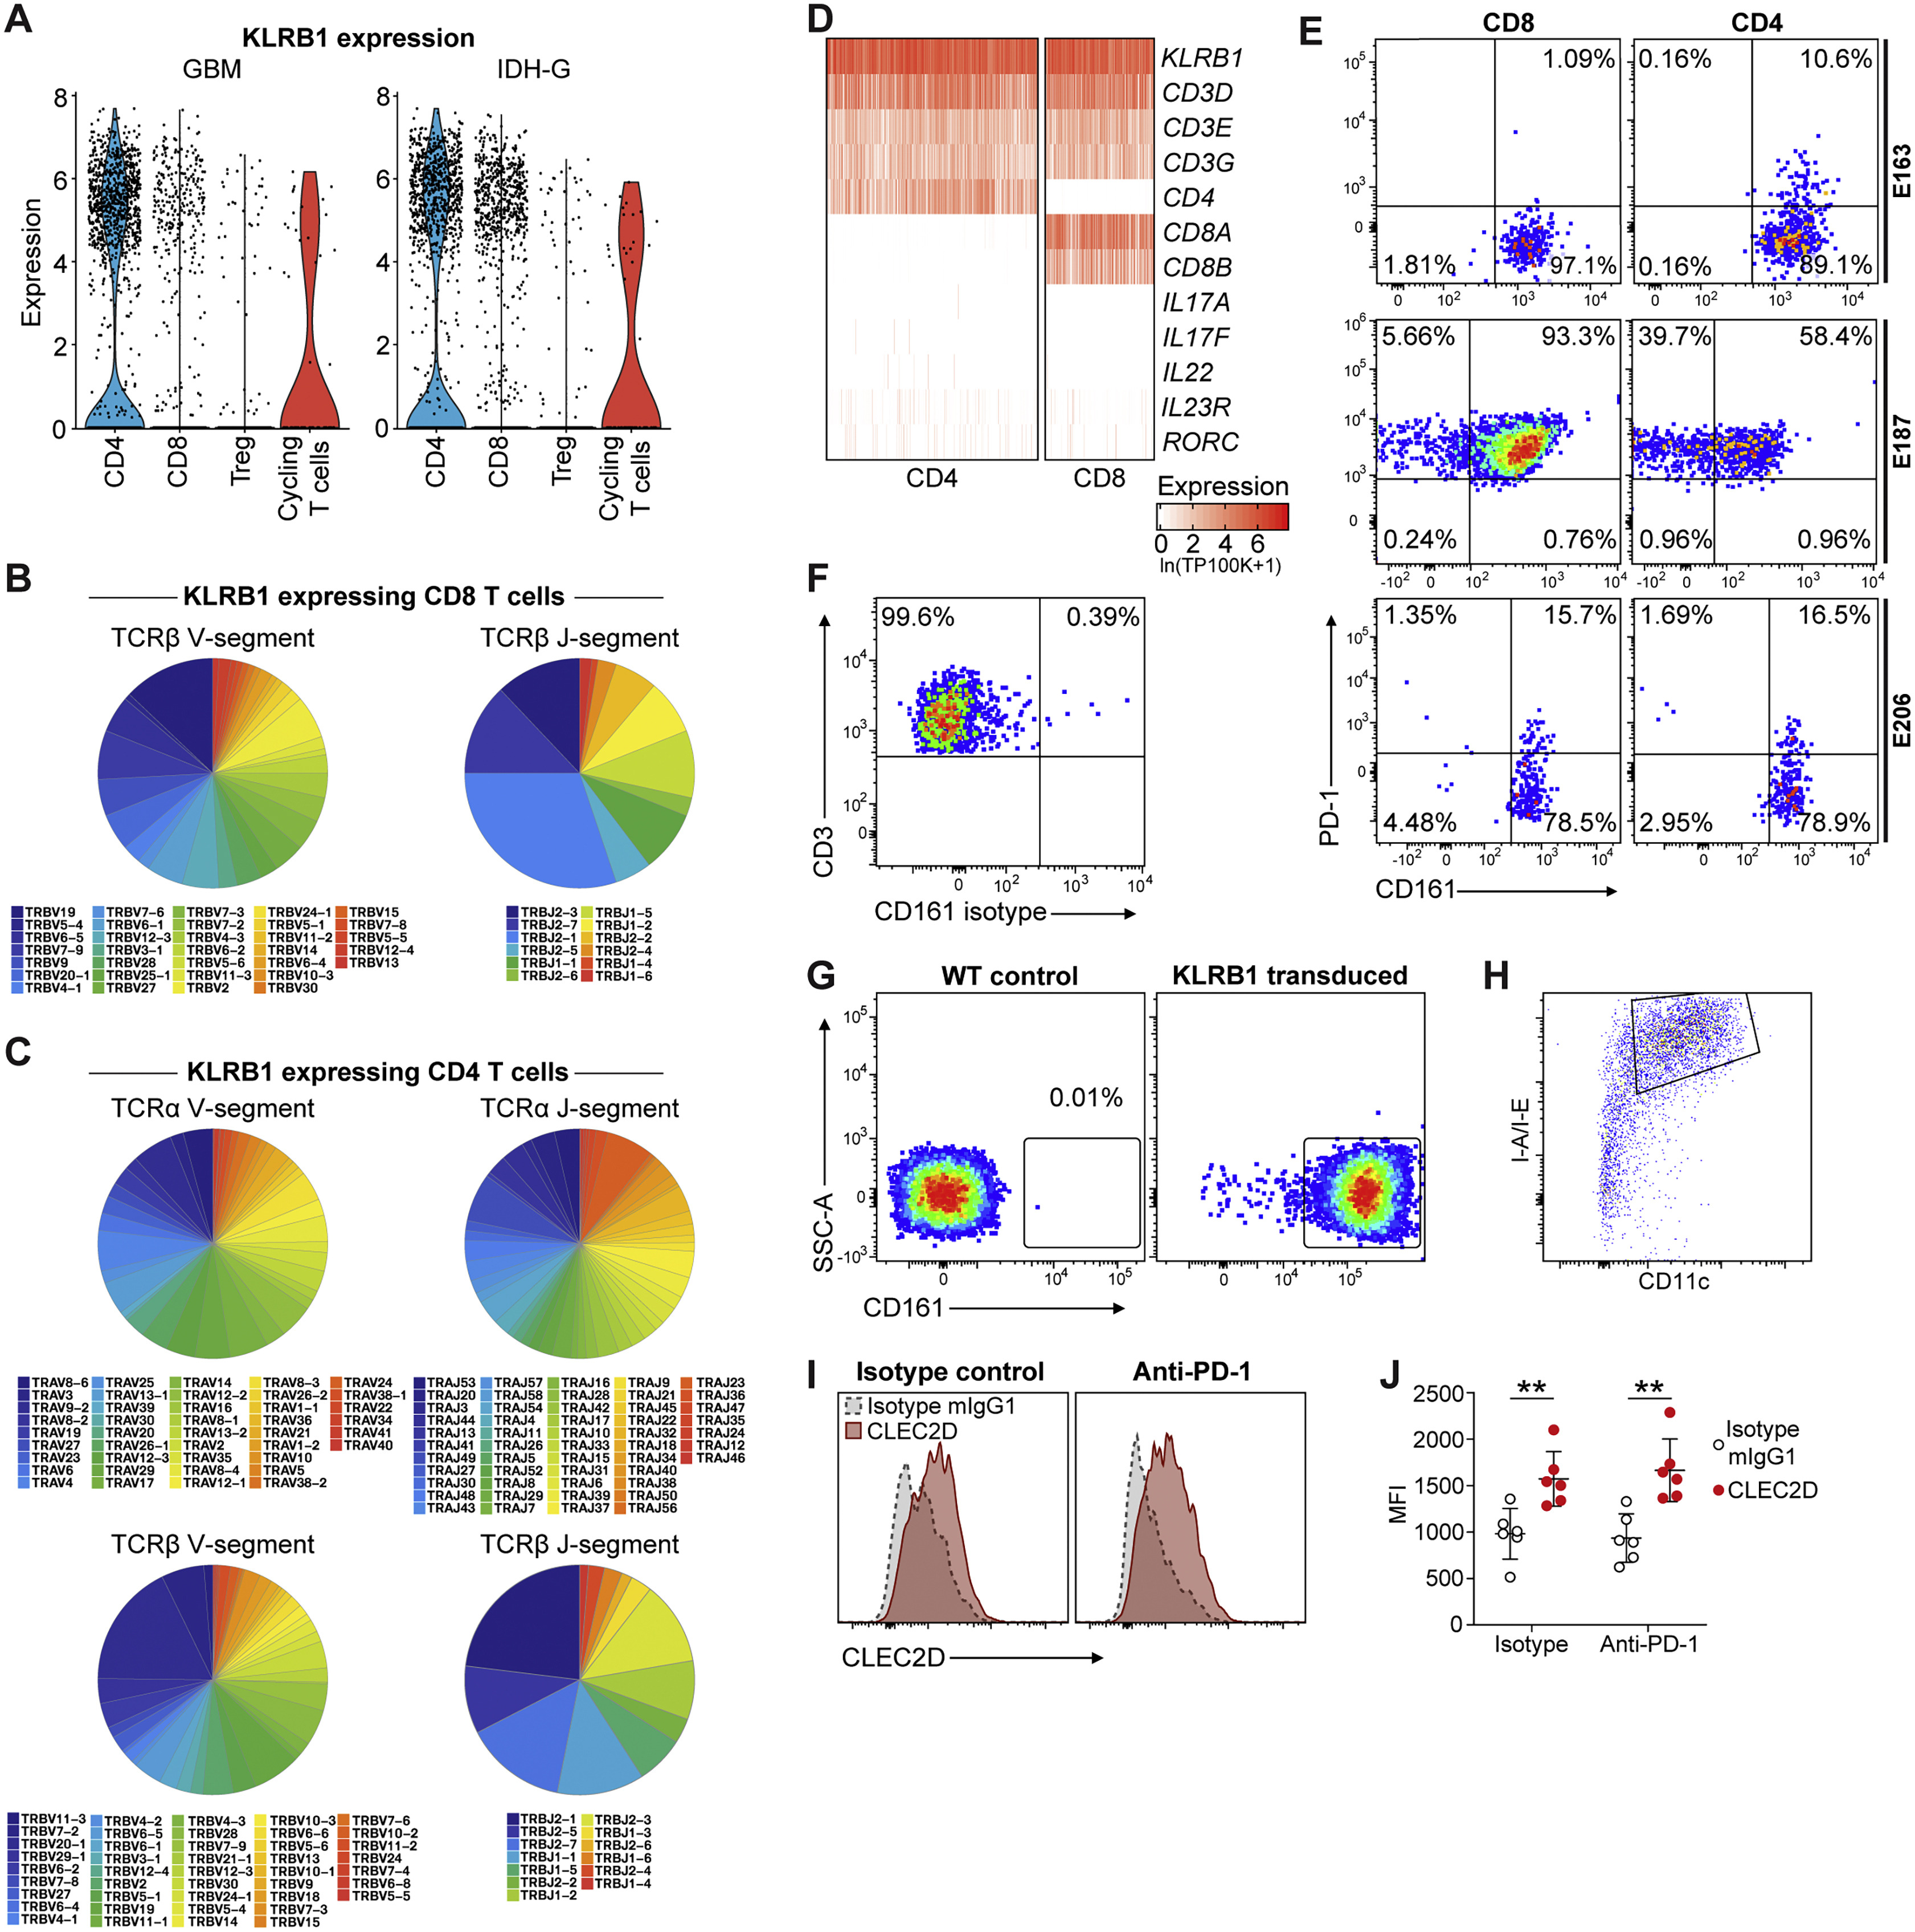
(A-D) Analysis of KLRB1 expressing T cells in SMART-seq2 dataset. (A) Violin plots showing KLRB1 expression across major T cell subpopulations in GBM (left) and IDH-G (right). Gene expression is given in units of ln(TP100K+1). (B-C) Diversity of TCR V-segment (left) and J-segment (right) rearrangements of KLRB1 expressing T cells shown for TCRβ chains of KLRB1 expressing CD8 T cells (B) and TCRα and β chains of KLRB1 expressing CD4 T cells (C). (D) Heatmap showing absolute expression of selected genes across KLRB1 expressing CD4 and CD8 T cells with emphasis on key T cell, Th17, and MAIT cell markers. Gene expression is given in units of ln(TP100K+1). (E, F) Quantification of GBM-infiltrating T cell populations for CD161 and PD-1 protein surface levels in three additional patients (E). CD161 gating is based on labeling with an isotype control mAb for each patient, shown for one patient in (F); live CD45+ CD3+ GBM T cells were stained with isotype control mAb (isotype matching CD161 mAb). (G) Specific detection of CD161 protein by flow cytometry with mAb used to study GBM-infiltrating T cells. Jurkat [E6-1] cells were transduced with the human KLRB1 cDNA using a lentiviral vector and labeling with a CD161 mAb was compared between WT control Jurkat cells (left) and KLRB1 cDNA transduced Jurkat cells (right). (H-J) Analysis of dendritic cells from murine GL261 tumors for expression of CLEC2D. (H) Gating strategy for analysis of murine dendritic cells (DCs). (I) Representative examples of CLEC2D mAb labeling (filled red) compared to mIgG1 isotype staining control (gray dashed line) on dendritic cells in GL261 tumors from mice treated with isotype control antibody (left) or PD-1 blocking antibody (right). (J) Summary of CLEC2D protein levels on dendritic cells in GL261 tumors from mice treated with isotype control antibody (left) or PD-1 blocking antibody (right). ∗∗p < 0.01 (Mann-Whitney U test), error bars denote SEM. MFI, mean fluorescent intensity. n = 6 tumors/group. (J) was performed twice.
Figure 5. Targeting of CD161 pathway enhances T cell activation and reduces PD-1 expression
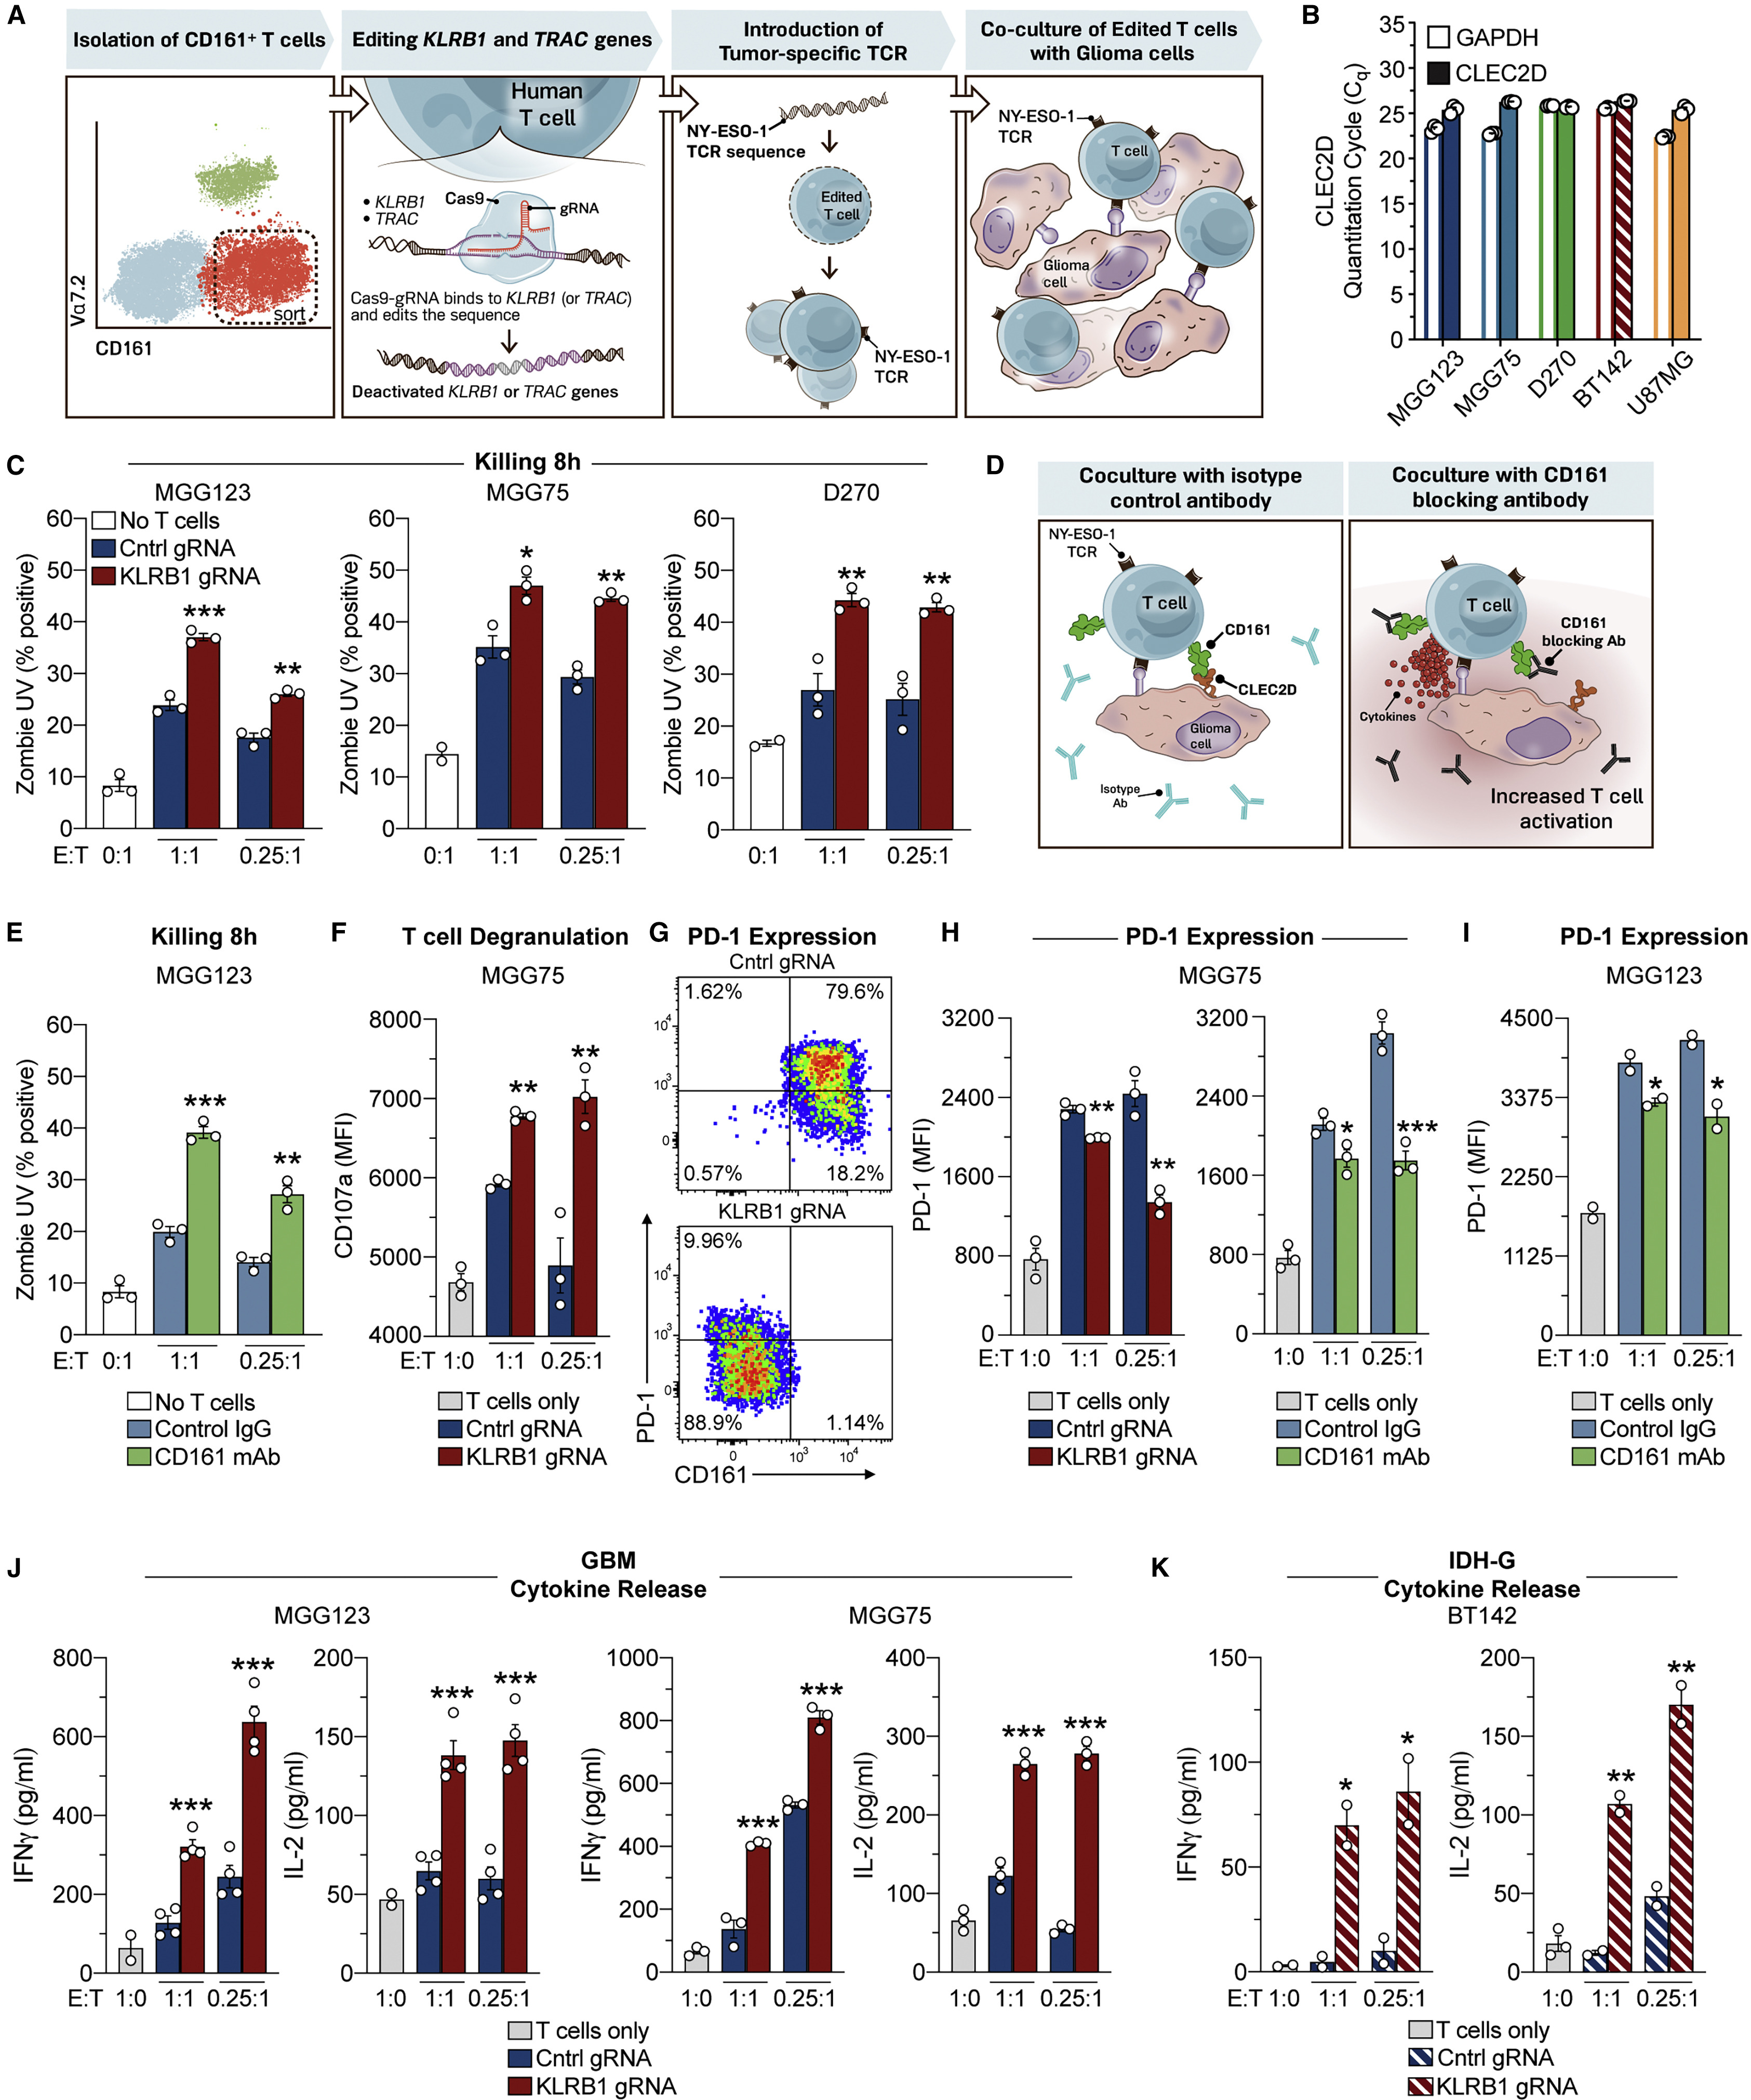
(A) Workflow of experimental strategy to interrogate the function of the KLRB1 gene in primary human T cells.
(B) qPCR analysis of CLEC2D and GAPDH mRNA in four gliomasphere cultures and U-87 MG cell line.
(C) T cell cytotoxicity assay. Gliomaspheres (MGG123, MGG75, or D270) were co-cultured with KLRB1- or control-edited T cells at an effector to target (E:T) ratio of 1:1 or 0.25:1 for 8 h. The percentage of killed (Zombie UV+) tumor cells was quantified by flow cytometry; cultures without T cells (0:1) were used to assess background levels of apoptosis.
(D) Strategy for evaluation of the CD161-CLEC2D pathway with a CD161-blocking mAb.
(E) T cell killing assay with CD161-blocking mAb (HP-3G10) or isotype control immunoglobulin G (IgG).
(F) Labeling of CD8 T cells after 24 h for surface localization of CD107a degranulation marker.
(G–I) Analysis of PD-1 expression by CD8 T cells. T cells were co-cultured for 72 h with patient-derived gliomaspheres at the indicated E:T ratios, and PD-1 surface expression was evaluated by flow cytometry. Pathway was targeted by editing of KLRB1 gene in T cells or addition of CD161-blocking mAb.
(J and K) Cytokine release by T cells. T cells were co-cultured for 72 h with gliomaspheres from GBM (MGG123 and MGG75) (J) or IDH-G (BT142) (K) at the indicated E:T ratios. Experiments in (C) were performed three times, experiments in (E–K) were performed two times, and experiments in (B) were performed once. ∗p < 0.05, ∗∗p < 0.01, ∗∗∗p < 0.001, all error bars denote SEM. Mann-Whitney U test (C, E, F, and H–K).
Figure S5. Engineering of human T cells for functional studies
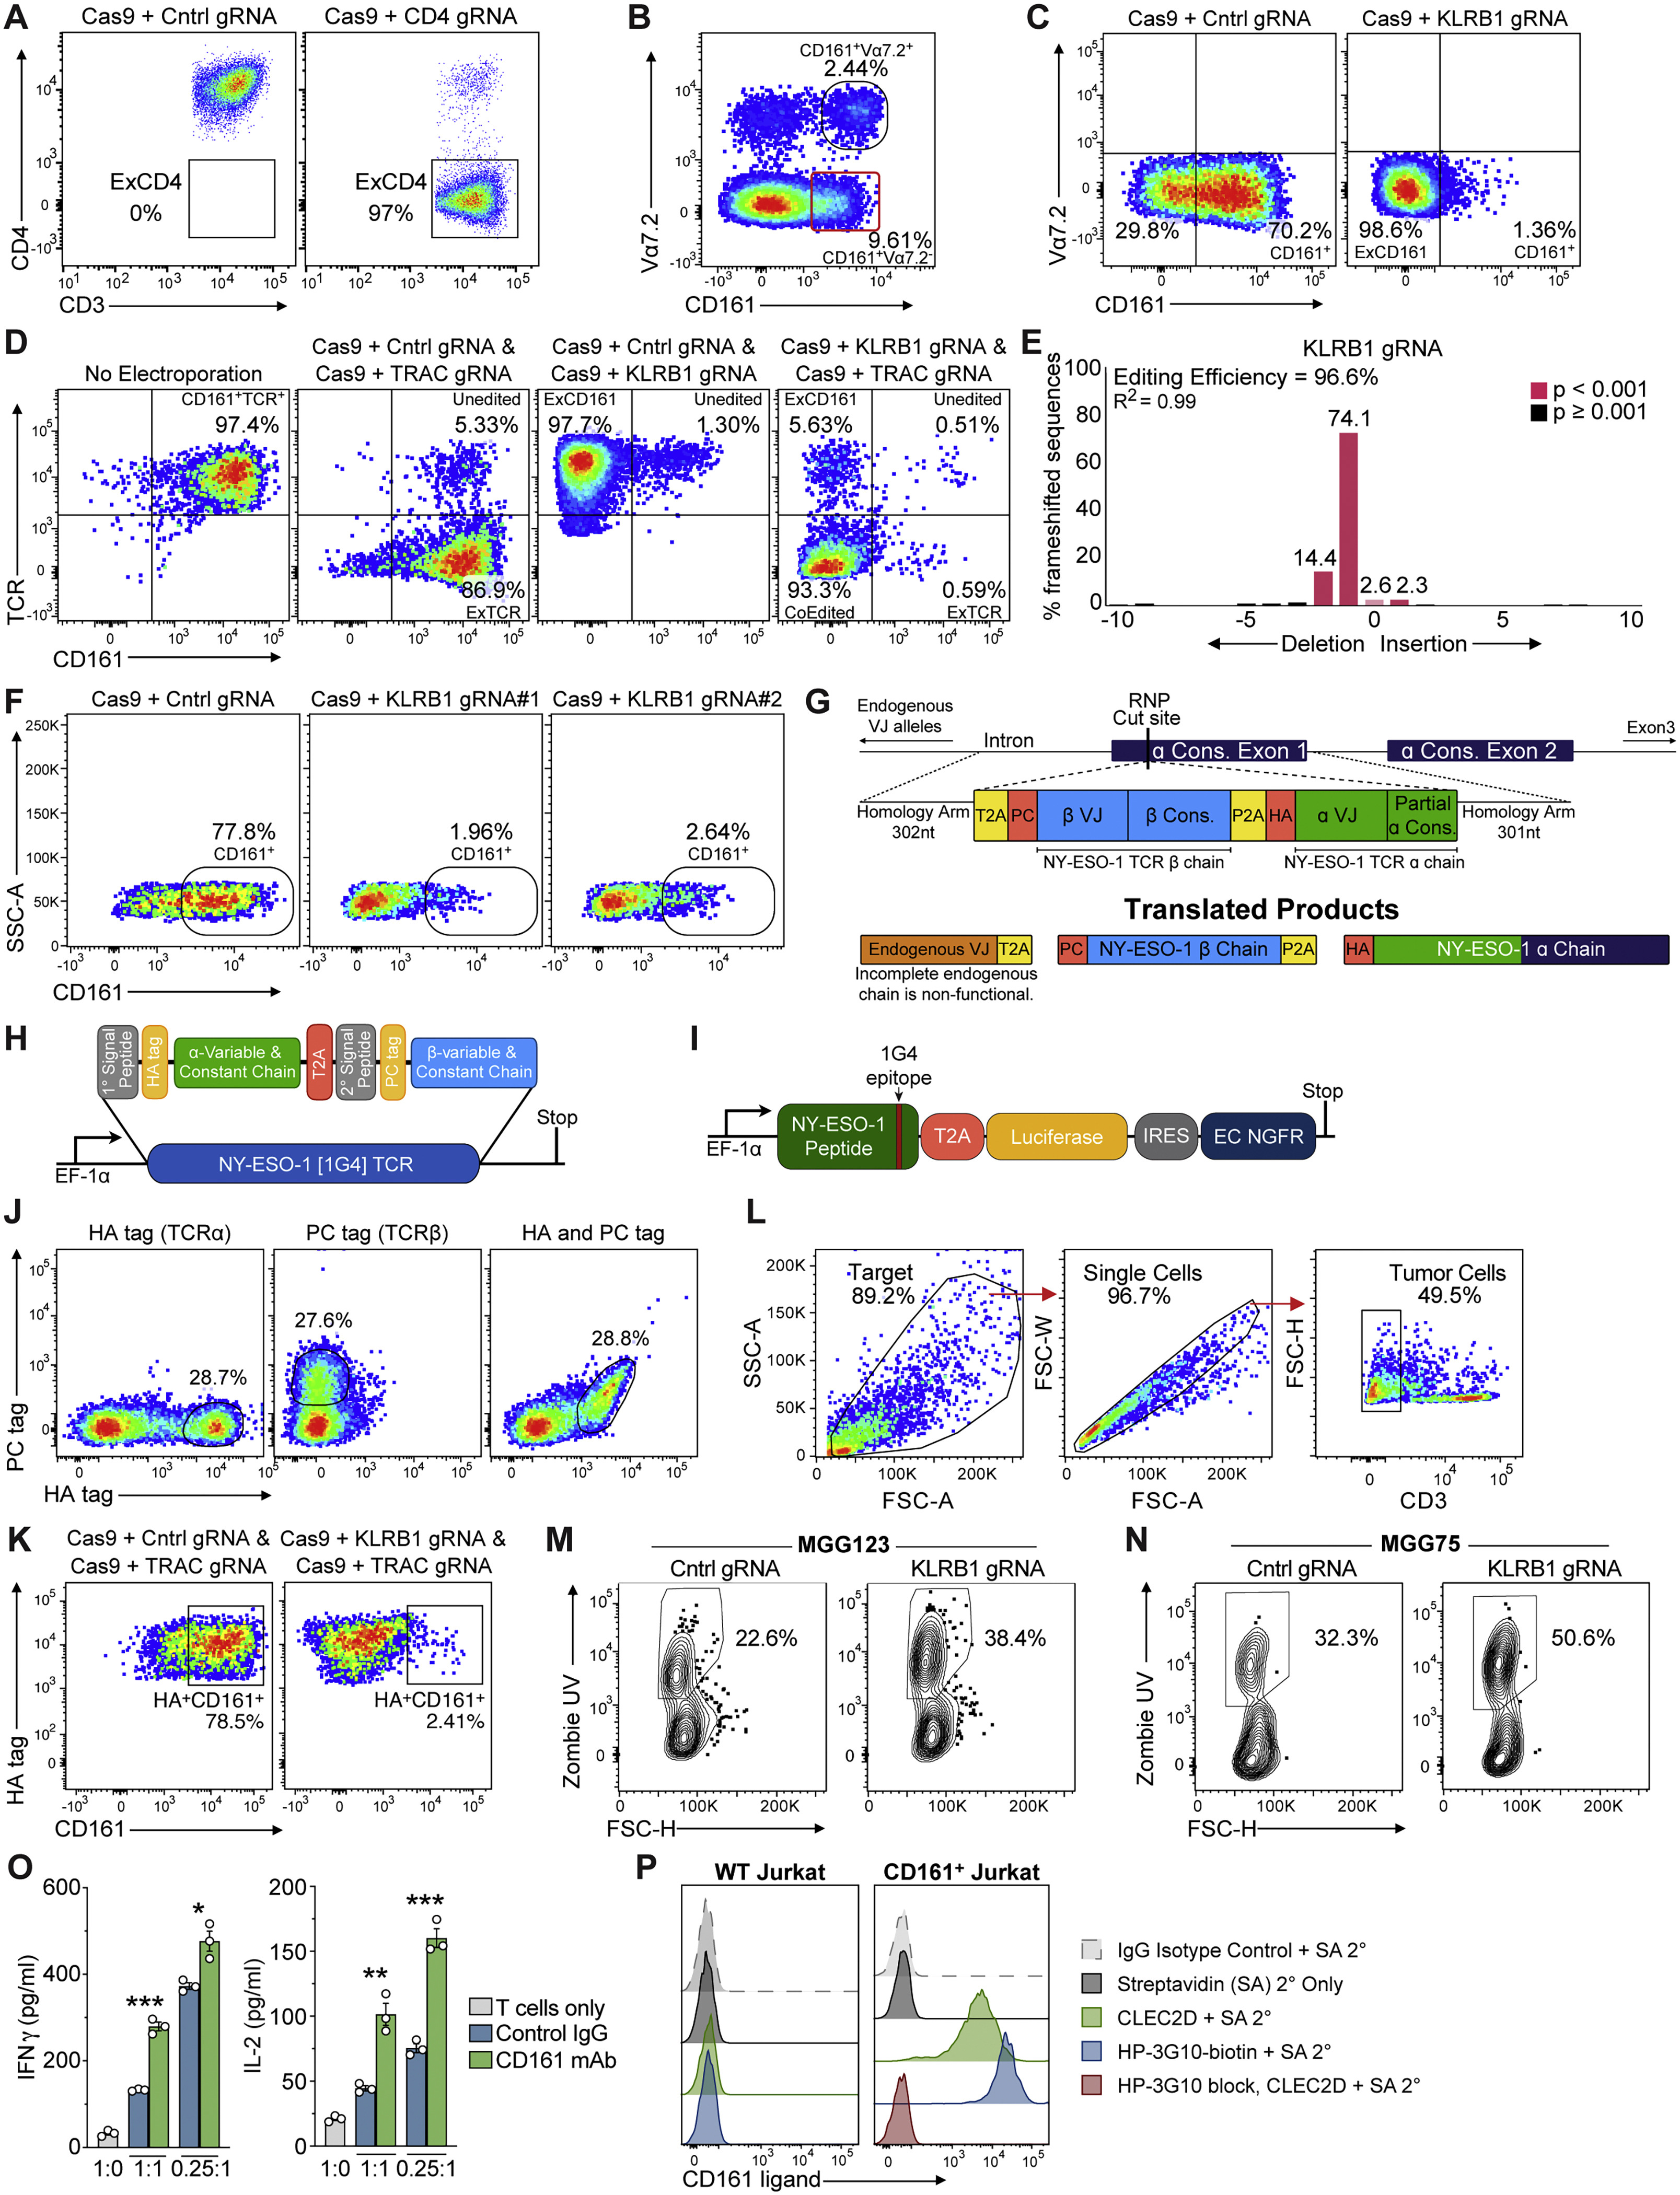
(A) Efficiency of gene editing procedure. Editing of primary human CD4+ T cells by electroporation of Cas9 protein with bound control (LacZ, left) or CD4 (right) gRNAs. Loss of CD4 protein expression (ExCD4) was quantified three days following editing. (B) CD161+ T cells negative for Vα7.2 (MAIT cell marker) were sorted from peripheral blood mononuclear cells (PBMCs) of a healthy donor. (C) CD161+ T cells were edited by electroporation of Cas9 protein with a bound control or KLRB1 gRNA and CD161 surface protein levels were quantified by flow cytometry. (D) CD161+ T cells were sorted from PBMCs of a healthy donor. T cells were either not edited (no electroporation) or edited by electroporation with Cas9 protein with bound gRNAs, using either control (Cntrl) + TRAC gRNAs, Cntrl + KLRB1 gRNAs, or KLRB1 + TRAC gRNAs. The TRAC gRNA targeted an exon encoding the constant domain of the TCR α chain to inactivate endogenous TCR α chains. Surface levels of TCR and CD161 proteins were quantified by flow cytometry three days following editing. (E) Quantification of editing efficiency for KLRB1 gene by Sanger sequencing using TIDE software, illustrating the frequency of nucleotide deletions/insertions. (F) CD161+ T cells were edited by electroporation of Cas9 protein with a bound control (intergenic) gRNA or with one of two KLRB1 gRNAs. CD161 surface protein levels were quantified by flow cytometry; both KLRB1 gRNAs yielded similar editing efficiencies. (G) Schema of endogenous TCR replacement with NY-ESO-1 (1G4) TCR by homology directed repair (HDR) template (2214 nt), used for all experiments utilizing gliomasphere models. The NY-ESO-1 β-chain and ⍺-chain were preceded by a PC tag and HA tag, respectively, to enable identification of the individual NY-ESO-1 TCR chains by flow cytometry. Each was preceded by a self-cleaving peptide enabling translation of separate TCR chains. An ~300nt homology arm was placed on either side of the construct which allowed site directed insertion into the TRAC gRNA cut site (Figure S5D), enabling the 3′ portion of the endogenous ⍺-constant region to be utilized, thereby decreasing the size of the required HDR template. T cells generated with this approach were used for all in vitro and in vivo experiments with patient-derived gliomasphere models (Figures 5, 6B–6J, S5M–S5O, S6A–S6C, and S6H–S6J). (H) Construct design for expression of NY-ESO-1 specific (1G4) TCR by lentivirus in primary human T cells, used for U-87 model experiments (Figures 6K–6N and S6D–S6F). HA and PC epitope tags were placed at the N terminus of the mature TCR α and β chains, respectively, to enable identification of both TCR chains on the cell surface. (I) Map of lentiviral construct with EF-1ɑ promoter regulated expression of the NY-ESO-1 protein containing the 1G4 epitope. A T2A skip sequence was used for co-expression of luciferase and an IRES was used for expression of the extracellular (EC), non-functional, domain of NGFR as a marker for transduced cells. (J) Labeling of transduced, unsorted T cells with PC and HA tag antibodies to identify 1G4 TCR α and β chains, respectively. (K) Characterization of T cells used for functional experiments shown in Figure 5. Edited T cells that expressed the NY-ESO-1 TCR were labeled with antibodies specific for CD161 and HA tag (NY-ESO-1 TCRα chain). T cells had been edited with Cas9 plus either Cntrl + TRAC or KLRB1 + TRAC gRNAs. The TRAC gRNA targeted the endogenous TCRα chain but not the introduced NY-ESO-1 TCR. Editing of the KLRB1 gene resulted in loss of CD161 protein at the cell surface (which also demonstrated the antigen specificity of the mAb used to quantify CD161 surface levels in Figures 4C–4E). (L-N) T cell cytotoxicity assay with patient-derived gliomaspheres. After an 8-h co-culture period, the percentage of Zombie UV+ (dead) glioma cells was quantified by gating first on single, CD3− cells (L) and then identifying the percentage of Zombie UV+ tumors cells (M, N). (M, N) Example flow cytometry plots for quantification of Zombie UV+ MGG123 (M) and MGG75 (N) glioma cells co-cultured either with control or KLRB1 edited T cells; data correspond to Figure 5C. (O) Cytokine release by T cells co-cultured with MGG75 glioma cells in the presence of CD161 blocking mAb or control IgG Ab for 72 h at the indicated E:T ratios. Secretion of IFNγ and IL-2 was quantified by ELISA. (P) Validation of HP-3G10 as a mAb that blocks CLEC2D ligand binding by the CD161 receptor. Detection of CD161 on the surface of WT Jurkat [E6-1] or Jurkat cells transduced with KLRB1 cDNA. Transfectants were stained with a biotinylated CLEC2D-Ig fusion protein (CLEC2D, green histogram) or biotinylated CD161 mAb [HP-3G10-biotin] (blue histogram) and bound proteins were detected with streptavidin-PE (SA 2°). Preincubation of CD161+ Jurkat cells with non-biotinylated HP-3G10 Ab (10 μg/ml) fully blocked binding of the biotinylated CLEC2D fusion protein (red histogram); bound CLEC2D fusion protein was detected with SA 2°-PE. Experiments in (A-E) and (K) were performed more than three times; (F), (L-O) were performed two times, (J) and (P) were performed once. ∗p < 0.05, ∗∗p < 0.01, ∗∗∗p < 0.001, error bars denote SEM. Mann-Whitney U test (O).
Figure S6. Enhanced function of T cells against glioma cells following inactivation of KLRB1 gene

(A-B) Analysis of T cell activation markers (CD25 and CD69) following co-culture with the patient-derived gliomasphere MGG75 for 72 h. T cells that expressed the NY-ESO-1 TCR were co-cultured with glioma cells at the indicated effector to target ratio (E:T). The CD161 pathway was investigated by editing T cells with a KLRB1 or control gRNA (A); alternatively, a CD161 blocking mAb or control IgG was added to co-cultures (B). (C) Cytokine release by T cells edited with two different KLRB1 gRNAs. KLRB1 gRNA#1 or KLRB1 gRNA#2 or control edited T cells were co-cultured for 72 h with GBM (MGG75) gliomaspheres at the indicated E:T ratios. Secretion of IFNγ and IL-2 was quantified by ELISA. (D-F) Co-culture experiments with T cells and U-87 MG tumor cells. (D) KLRB1 or control edited primary T cells that expressed a NY-ESO-1 specific TCR were co-cultured with U-87 MG cells that expressed NY-ESO-1 protein, and secreted cytokines (IFNγ and IL-2) were quantified by ELISA after 72 h for the indicated T cell to tumor cell ratios. (E, F) Quantification of surface levels of PD-1 (E) and a larger panel of inhibitory receptors (F) on CD8 T cells edited with control or KLRB1 gRNAs. PD-1 expression is shown for different T cell to tumor ratios (E); analysis of a panel of inhibitory receptors is shown for 2:1 ratio of T cells to tumors (F), gated on CD161 positive or negative cells. (G) Proof of concept stereotactic injection of 1.75% Brilliant blue R into the lateral ventricle of an anesthetized mouse. Mice were immediately euthanized following injection and the intact brain was removed at necropsy. Gross examination revealed the needle track lateral of the sinus artery (top). A coronal section intersecting the injection site visualized the dye in both lateral ventricles (which are connected), even though the needle was inserted to predetermined coordinates (right) of only one ventricle. No staining of the lateral ventricles was observed when the needle was withheld at the corpus callosum (control injection, left). (H) H&E stained coronal section of the mouse brain shows MGG123 GBM in the left hemisphere, accompanied by mass effect with midline shift and hemorrhage. Insets 1 (white matter) and 2 (cortex) highlight infiltration of brain parenchyma by pleomorphic GBM cells (arrowheads) (corresponds to Figure 6B). (I-J) Second in vivo experiment with GBM formed by patient-derived MGG123 gliomaspheres implanted into NSG mice. Mice received T cells that expressed a NY-ESO-1 TCR and had been edited with a KLRB1 or control gRNA. Tracking of tumor burden by BLI (I) and analysis of survival (J) for the experimental and control groups; corresponds to similar experiment in Figures 6C–6E. (K) BLI tracking of tumor burden for U-87 MG model; mice received a single transfer of KLRB1 or control edited T cells that expressed a NY-ESO-1 TCR; experiment corresponds to survival curve shown in Figure 6K. Experiments in (D) were performed three times; (A-C), (E-F) and (I-K) were performed two times; (H) was performed once. ∗p < 0.05, ∗∗p < 0.01, ∗∗∗p < 0.001, ∗∗∗∗p < 0.001, error bars denote SEM. Mann-Whitney U test (A-F), (I) and Log-rank (Mantel-Cox) test (J).
Figure 6. KLRB1 gene inactivation in T cells improves survival in two humanized GBM models

(A) Schematic indicating injection sites of GBM cells into the striatum and T cells into the contralateral lateral ventricle.
(B) Coronal section of the mouse brain at survival endpoint.
(C) Bioluminescence imaging (BLI) on day −1 (relative to first T cell injection).
(D) Kinetic analysis of tumor burden based on BLI signal from mice that received KLRB1- or control-edited T cells; day 0 corresponds to first T cell injection; 2nd T cell injection is indicated.
(E) Survival analysis for MGG123 model following transfer of KLRB1- or control-edited T cells.
(F–J) Flow cytometry analysis of KLRB1- or control-edited T cells infiltrating MGG123 at a late disease stage (moribund).
(K) Survival analysis for U87 model following transfer of KLRB1- or control-edited T cells.
(L–N) Flow cytometry analysis of T cells from U-87 MG tumors 8 days following T cell injection. Experiments in (C–E) and (K) were performed twice; (F–J) and (L–N) were performed once. ∗p < 0.05, ∗∗p < 0.01, ∗∗∗p < 0.001, all error bars denote SEM. Mann-Whitney U test (D, F–J, L–N) and log-rank (Mantel-Cox) test (E and K).
Figure 7. Identification of a T cell KLRB1 program across multiple cancer types

(A) t-Distributed stochastic neighbor embedding (t-SNE) visualization showing expression of key genes in T cells isolated from lung adenocarcinoma. Gene expression is given in units of ln(TP100K+1).
(B) Averaged expression of genes in tumor-infiltrating T cells (TILs) in GBM + IDH-G (y axis) versus melanoma (x axis). The inset lists the genes with the greatest log2 fold change.
(C and D) Overlap of KLRB1 transcriptional programs in CD8 T cells (left) and CD4 T cells (right) between the different pairs of cancer datasets. The p values (C) and observed versus expected ratio (D) express the significance (hypergeometric test) and magnitude of the overlap between genes in the KLRB1 transcriptional programs from the different cancers. The Melanoma1 and Melanoma2 datasets refer to two separate melanoma scRNA-seq studies (Jerby-Arnon et al., 2018; Sade-Feldman et al., 2018).
(E) Heatmap showing the expression of all genes for the pan-cancer KLRB1 program. This pan-cancer KLRB1 program was defined based on overlap in the individual KLRB1 programs from six scRNA-seq cancer datasets. Gene expression of the pan-cancer program is shown for CD4 and CD8 T cells from the gliomas in this study (GBM and IDH-G), and T cells are further divided into KLRB1-expressing and KLRB1-non-expressing cells. Gene expression is zero-centered, and given in units of ln(TP100K+1).
Figure S7. T cell KLRB1 program across multiple cancer types

(A-C) t-SNE visualization of gene expression by T cells from three cancer types, colored by expression of T cell marker genes (CD3D, CD4, CD8A, and FOXP3) as well as KLRB1 and PDCD1 genes. Cancers include melanoma (A), liver cancer (B), and colorectal cancer (C). (D-E) t-SNE visualizations of tumor-infiltrating T cells showing low expression of signature genes for Th17 cells (RORC, IL17A, and IL17F) in liver cancer (D) and colorectal cancer (E). Gene expression is given in units of ln(TP100K+1) for (A-E). (F-G) t-SNE visualization of T cells from liver cancer (F) and colorectal cancer (G) colored by the authors’ annotations of T cell subsets (Zheng et al., 2017; Zhang et al., 2018b). MAIT cells represented 4% of T cells in liver cancer and 1% in colorectal cancer. The ‘unknown’ T cell subset in liver cancer is based on the author’s annotation. (H) Averaged expression of genes in tumor-infiltrating T cells in GBM + IDH-G (y axis) versus melanoma (x axis) shown for CD8 T cells (left) and CD4 T cells (right). The insets list selected genes that were expressed at a higher level in gliomas (up) compared to melanoma; expression is log2 fold change. (I) Correlation of expression between KLRB1 and genes encoding IL-18 receptor subunits (IL18R1, IL18RAP). The correlation between KLRB1 and IL18R1 was 0.12 (p < 1e-15) and the correlation between KLRB1 and IL18RAP was 0.19 (p < 1e-15). Gene-gene correlations in single cell RNA-seq data are often lower due to technical dropout effects.