

Abstract
Precise generation of excitatory neurons and inhibitory interneurons is crucial for proper formation and function of neural circuits in the mammalian brain. Because of the size and complexity of the human brain, it is a challenge to reveal the rich diversity of interneurons. To decipher origin and diversity of interneurons in the human fetal subpallium, here we show molecular features of diverse subtypes of interneuron progenitors and precursors by conducting single-cell RNA sequencing and in situ sequencing. Interneuron precursors in the medial and lateral ganglionic eminence simultaneously procure temporal and spatial identity through expressing a combination of specific sets of RNA transcripts. Acquisition of various interneuron subtypes in adult human brains occurs even at fetal stages. Our study uncovers complex molecular signatures of interneuron progenitors and precursors in the human fetal subpallium and highlights the logic and programs in the origin and lineage specification of various interneurons.
Methods
Quality control, doublet removal and cell cycle analysis
Four 10x-derived sequencing datasets, representing GW9, GW10, GW11 and GW12, were obtained.
Quality control was performed to filter out low-quality cells. Only cells with over 1,000 sequenced genes and a proportion of the unique molecular identifier count attributable to mitochondrial genes below 10% were retained. Sex-specific genes (DDX3Y, EIF2S3Y, UTY, KDM5D, XIST, TSIX and SRY) were also removed for downstream analyses.
Doublets were abducted by Doublet Detection (https://github.com/JonathanShor/DoubletDetection) using default parameters.
After the filtering processes, 17,822 cells were removed, leaving 9,118 cells for sample GW9, 14,397 cells for GW10, 11,068 cells for GW11 and 5,989 cells for GW12.
To remove the effect of cell cycle on cell clustering and dimensionality reduction, Seurat packages, containing a cell-cycle-related gene set with 46 genes for the G1/S phase and 54 genes for the G2/M phase of the cell cycle, were applied. The G1/S and G2/M states of each cell were defined using the CellCycleScoring function, and the difference between the G2M and S phase scores were regressed out using the ScaleData function.
Clustering and annotation
The downstream analysis was performed using data normalization (NormalizeData, LogNormalize method, scaling factor 10,000), data feature scaling (ScaleData), variable gene detection (FindVariableGenes, top 2,000 genes with the highest standardized variance selected using the vst selection method), PCA (RunPCA, from variable genes) and Louvain graph-based clustering (FindClusters, data dimensionality reduction using PCA; the PCA number was 30, and the clustering resolution was 0.60, performed using the R package Seurat (v.3.1.2)). The top 30 significant prinicpal components (PCs) were selected to alleviate technical variation between different batches by using the R package Harmony.
Cluster cell identity was assigned by manual annotation using known marker genes and computed DEGs using the FindAllMarkers function (thresh.use = 0.25, test.use = ‘bimod’) with the Seurat R package.
Genes with average expression difference greater than 0.5 natural log with P < 0.05 were selected as marker genes.
Seven major clusters were identified and annotated as NSCs, INPs, IPCs, excitatory neurons, OPCs, MG and ECs.
Visualization was performed using t-SNE to present data in two-dimensional coordinates, generated by the RunTSNE function in Seurat, and t-SNE plots were generated using the R package ggplot2.
Random forest classifier was performed by scikit-learn. A set of cluster marker genes was used as input features to define those cells as interneuron progenitors and precursors. Grid-search was used to obtain optimal parameters (max_features = 7, n_estimators = 2,500) to training model and prediction.
Interneuron progenitors (P1, P2, P3, P4, P5 and P6) were further assessed and were separated into subsets and reanalyzed with data normalization (NormalizeData, LogNormalize method, scaling factor 10,000), data feature scaling (ScaleData) and variable gene detection (FindVariableGenes, top 1,000 genes with the highest standardized variance selected using the vst selection method). The variable genes were used to run PCA dimension reduction by RunPCA function, and the top ten PCs were used to perform t-SNE dimensionality reduction by the RunTSNE function. The marker genes of the VZ and SVZ were identified by the FindAllMarkers function.
The same reanalysis processes were used on MGE-INPs, CGE-INPs and LGE-INPs.
To obtain proper results, different parameters were used.
The top 1,000 MGE-INP variable genes were used, whereas the top 2,000 CGE-INP and LGE-INP variable genes were used.
The PCA number used in MGE-INP was 30, and the PCA number used in CGE-INPs and LGE-INPs was 20.
For the
FindClustersfunction, the difference resolution was set (0.30 in MGE-INPs of GW9–GW12; 0.68 in CGE-INPs of GW9 and GW11 and 0.5 of GW9–GW12; and 0.30 in LGE-INPs of GW9 and GW11 and 0.6 of GW9–GW12).Cluster cell identity was assigned by manual annotation using known marker genes, and DEGs were computed using the
FindAllMarkersfunction (thresh.use = 0.25, test.use = bimod) with the Seurat R package. Genes with an average expression difference of more than 0.5 natural log with P < 0.05 were selected as marker genes.
Trajectory and lineage analysis
PAGA was applied to predict a lineage tree for the interneuron progenitors and precursors.
The Seurat project was transformed into a loom file by the as.loom function of the Seurat package. The loom file was input to build an AnnData type file using the sc.read_loom function of the Scanpy package.
The default process of Scanpy packages was then performed to compute neighbor and constructing networks of clusters using PAGA (threshold was set as 0.01 and graph by ForceAtlas2).
To further explore the relationship between neural progenitor cells and interneuron precursors, both neural progenitor cells and interneuron precursors for the MGE, LGE and CGE were annotated and analyzed using diffusion map. PCA embedding was used as the input to build diffusion map embedding with the DiffusionMap function.
Monocle 2 was applied to construct LGE and CGE pseudotime trajectories to discover developmental transitions. Subpallial cells of GW9 and GW11 were first analyzed. The LGE-INP and CGE-INP ordering genes were used as the differential genes, which were identified by the FindAllMarkers function of the Seurat package (log fold change > 0.25, pct.1 > 0.4 and pct.2 < 0.4). The dimension was reduced using DDRTree.
Branch analyses were performed using the BEAM test on branch points at the two cellular hierarchies using all default parameters with the exception of the dimensionality of the embedding. The same parameters were used to analyze cells from brains of GW9–GW12 using Monocle 2.
Cell lineage reconstruction of MGE was performed using the Destiny R package. Subpallial cells of GW9 and GW11 were first analyzed. PCA embedding was used as the input to build diffusion map embedding with the DiffusionMap function. Trajectories and the pseudotime were calculated with the Slingshot R package using diffusion map embedding as input. The significant genes along the pseudotime were calculated using Monocle 2 by the differentialGeneTest function (df = 3) and q < 0.001 as significant genes. The same parameters were used to analyze cells from brains of GW9–GW12. The DEGs among vMGE and dMGE were identified by the ‘FindMarkers’ function of the Seurat package.
Human adult M1 interneuron cell types
A publicly available dataset of GABAergic interneurons of the human adult M1 was employed (http://celltypes.brain-map.org/rnaseq).
The 23,992 cells that were assigned as GABA interneurons were selected to perform the Seurat analyses.
In brief, the SCTransform function was used to normalize and scale the data. PCA was then run to select the top 30 PCs to perform clustering. A total of five and 13 non-overlapping types and subtypes of interneurons were identified (resolution = 0.15), respectively.
Mapping human fetal interneurons using a dataset from human adult brains
Genetic fate-mapping strategies were employed to analyze the developmental stages of cortical interneurons from the human fetal GE in the subpallium (GW9–GW12) to the adult cortex. The fetal GE cells included progenitors and GE-derived precursors (P1, P2, P3, P4, P5, P6, MGE1, MGE2, CGE, LGE1, LGE2 and LGE3). The integration process from Seurat packages was performed to identify the connections between fetal (GW9 and GW11) and adult datasets.
In brief, the SCTransform function was employed, and 3,000 variable genes were selected for the integration analysis;
k.anchor = 5 and k.filter = 200 were set to identify anchors between the datasets. RunPCA was performed on the integrated dataset, and the results were visualized by uniform manifold approximation and projection (UMAP).
A method was applied to assigned cells from fetal datasets to adult interneuron subtypes, performed separately for GW9 and GW11 to the adult cortex.
The top 30 PCA embeddings were used as input to calculate the distance matrix. The k = 10 closet neighbors were calculated in the adult dataset for each cell in the fetal dataset, and at least nine of the neighbors in the adult dataset were of the same subtype, and then the fetal cell was assigned to this subtype. Moreover, for each fetal cell, the nearest k = 10 neighbors were calculated across all cells in the merged fetal and adult dataset. If none of the ten neighbors represented the cells in the adult dataset, this cell was considered unassigned. This mapping procedure was performed twice, to assign cells to the five main interneuron types and to 13 subtypes.
The FindConservedMarkers function in Seurat was employed to identify DEGs between cell types that were conserved throughout development. The FindConservedMarkers function ran differential expression tests on the fetal and adult datasets. Genes with log2 fold change > 0.25 and adjusted P < 0.01 were considered conserved markers in the fetal and adult datasets.
Differentiation analysis of interneurons
Cell types were compared using the Seurat FindMarkers function and test method using bimod to explore the divergence among different cell types in the data. The signature differential gene threshold was set to log2 fold change > 0.25 and adjusted P < 0.05.
GO analysis and GSEA
GO enrichment analysis and GSEA were performed using the R package clusterProfiler to explore function discrepancy. The gene list, which is sorted by log2 fold change, was used to perform GSEA analysis.
Transcription regulation network analysis
CGE-INP development pseudotime-associated transcription factors were selected to build a transcription regulation network by GENIE3. Interesting transcription factors were set as regulators, and the expression matrix of CGE-INPs was set as input data to construct a transcription target gene network using GENIE3. The top 1,000 gene links were then plotted using Cytoscape.
Figure
Fig. 1: Molecular diversity of the human fetal subpallium.
a, Experimental workflow of single-cell RNA-seq of human fetal subpallium collected from brains at GW9 to GW12 (GW9, GW10, GW11 and GW12). b, Cell clustering of human fetal subpallial samples (GW9–GW12) integrated using Harmony and depicted using t-SNE. c, Representative genes expressed in cell clusters from the human fetal subpallium visualized using t-SNE. Each dot represents one cell. Five major clusters include NPCs (progenitors 1–6), INPs, OPCs, MG and ECs. d, Abstracted graph illustrating a landscape of a developmental trajectory from interneuron progenitors to GE-derived precursors using PAGA. e, PAGA connectivity scores of interneuron progenitor and precursor populations. f–h, Lineage analyses by combining genes for neural progenitors and for distinct interneuron precursors in the MGE (f), CGE (g) and LGE (h).
Fig. 2: Characterization of heterogeneity of interneuron progenitors in the human fetal subpallium.
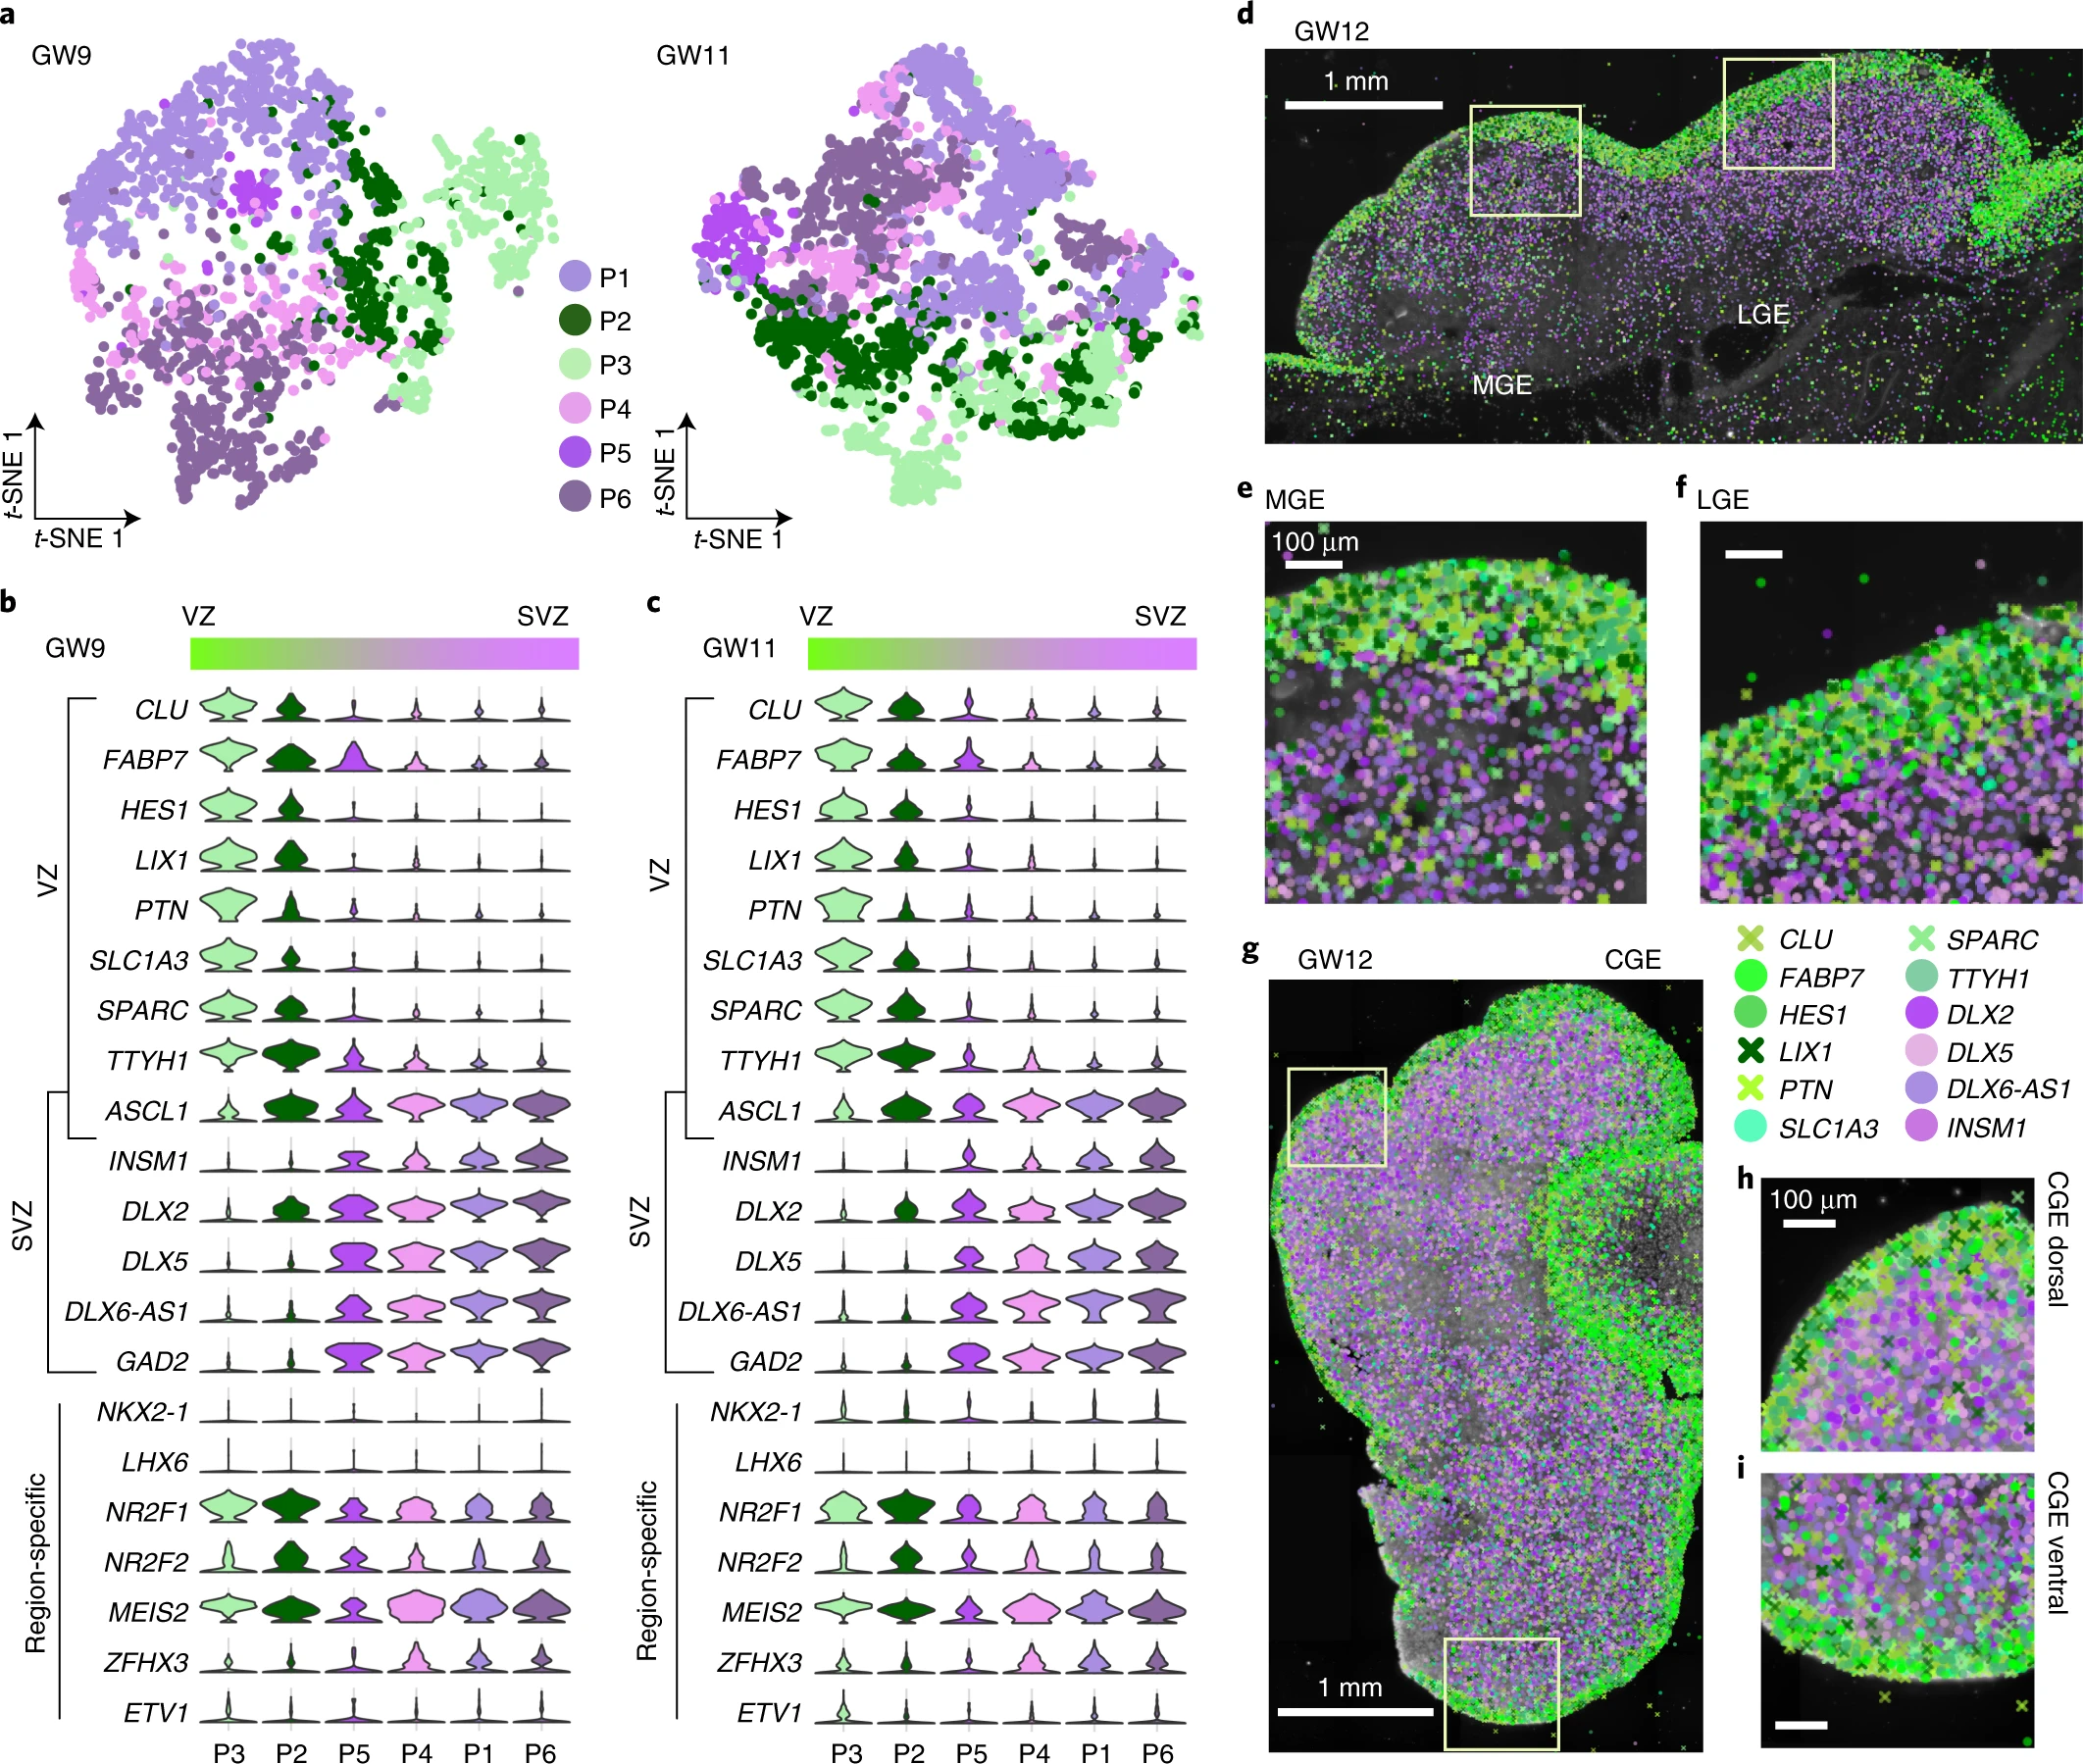
a, Visualization of cell diversity of interneuron progenitors (P1–P6) from the subpallium at GW9 and GW11 using t-SNE. b, c, Violin plots of expression patterns of progenitor markers expressed in the VZ and SVZ at GW9 (b) and GW11 (c) in the subpallium. d–i, Expression patterns of 12 progenitor marker genes in coronal sections of human fetal brains at GW12 as detected using ISS. Boxed areas in d and g are shown in high-power views in e and f and in h and i, respectively. Genes expressed in the VZ and SVZ are shown in green and purple pseudo-colors, respectively, in the MGE, LGE and CGE. Scale bars, 1 mm in d and g; 100 µm in e, f, h and i.
Fig. 3: Expression patterns of subpallial genes in the GE of the human fetal brain as detected by ISS.

a, b, Coronal sections labeled with DAPI to illustrate cell nucleoli of a human fetal brain at GW12. Boxed areas highlight the MGE, LGE and CGE. The dorsal (D), ventral (V), medial (M) and lateral (L) orientations of the sections are labeled. c, Workflow of ISS. d, e, Merged expression images of 48 genes, illustrated by pseudo-colors, in the coronal sections of MGE/LGE (d) and CGE (e) of the human fetal brain at GW12, as detected by ISS. Scale bars, 1 mm.
Fig. 4: Specification of MGE-derived interneuron precursors.

a, Clustering of MGE-derived interneuron precursors from GW9 and GW11 visualized by t-SNE embedding. b, Heat map of DEGs from five subclusters. c, Diffusion map of the most variable genes and reconstruction of the cell lineages. Dots represent cells; black lines represent constructed cell lineage-1 and lineage-2. d–f, Expression patterns of 12 MGE precursor marker genes in coronal sections of human fetal brains at GW12 as detected using ISS. The dorsal and ventral MGEs are labeled as dMGE (e) and vMGE (f), respectively. g–i, The developmental trajectory of MGE genes with preferred expression domains in dMGE (g), vMGE (h) and MGE (i). The error bands are presented as mean ± s.e.m., and the level of confidence interval is 0.95. Scale bar, 1 mm.
Fig. 5: Two lineages of LGE-derived interneuron precursors.
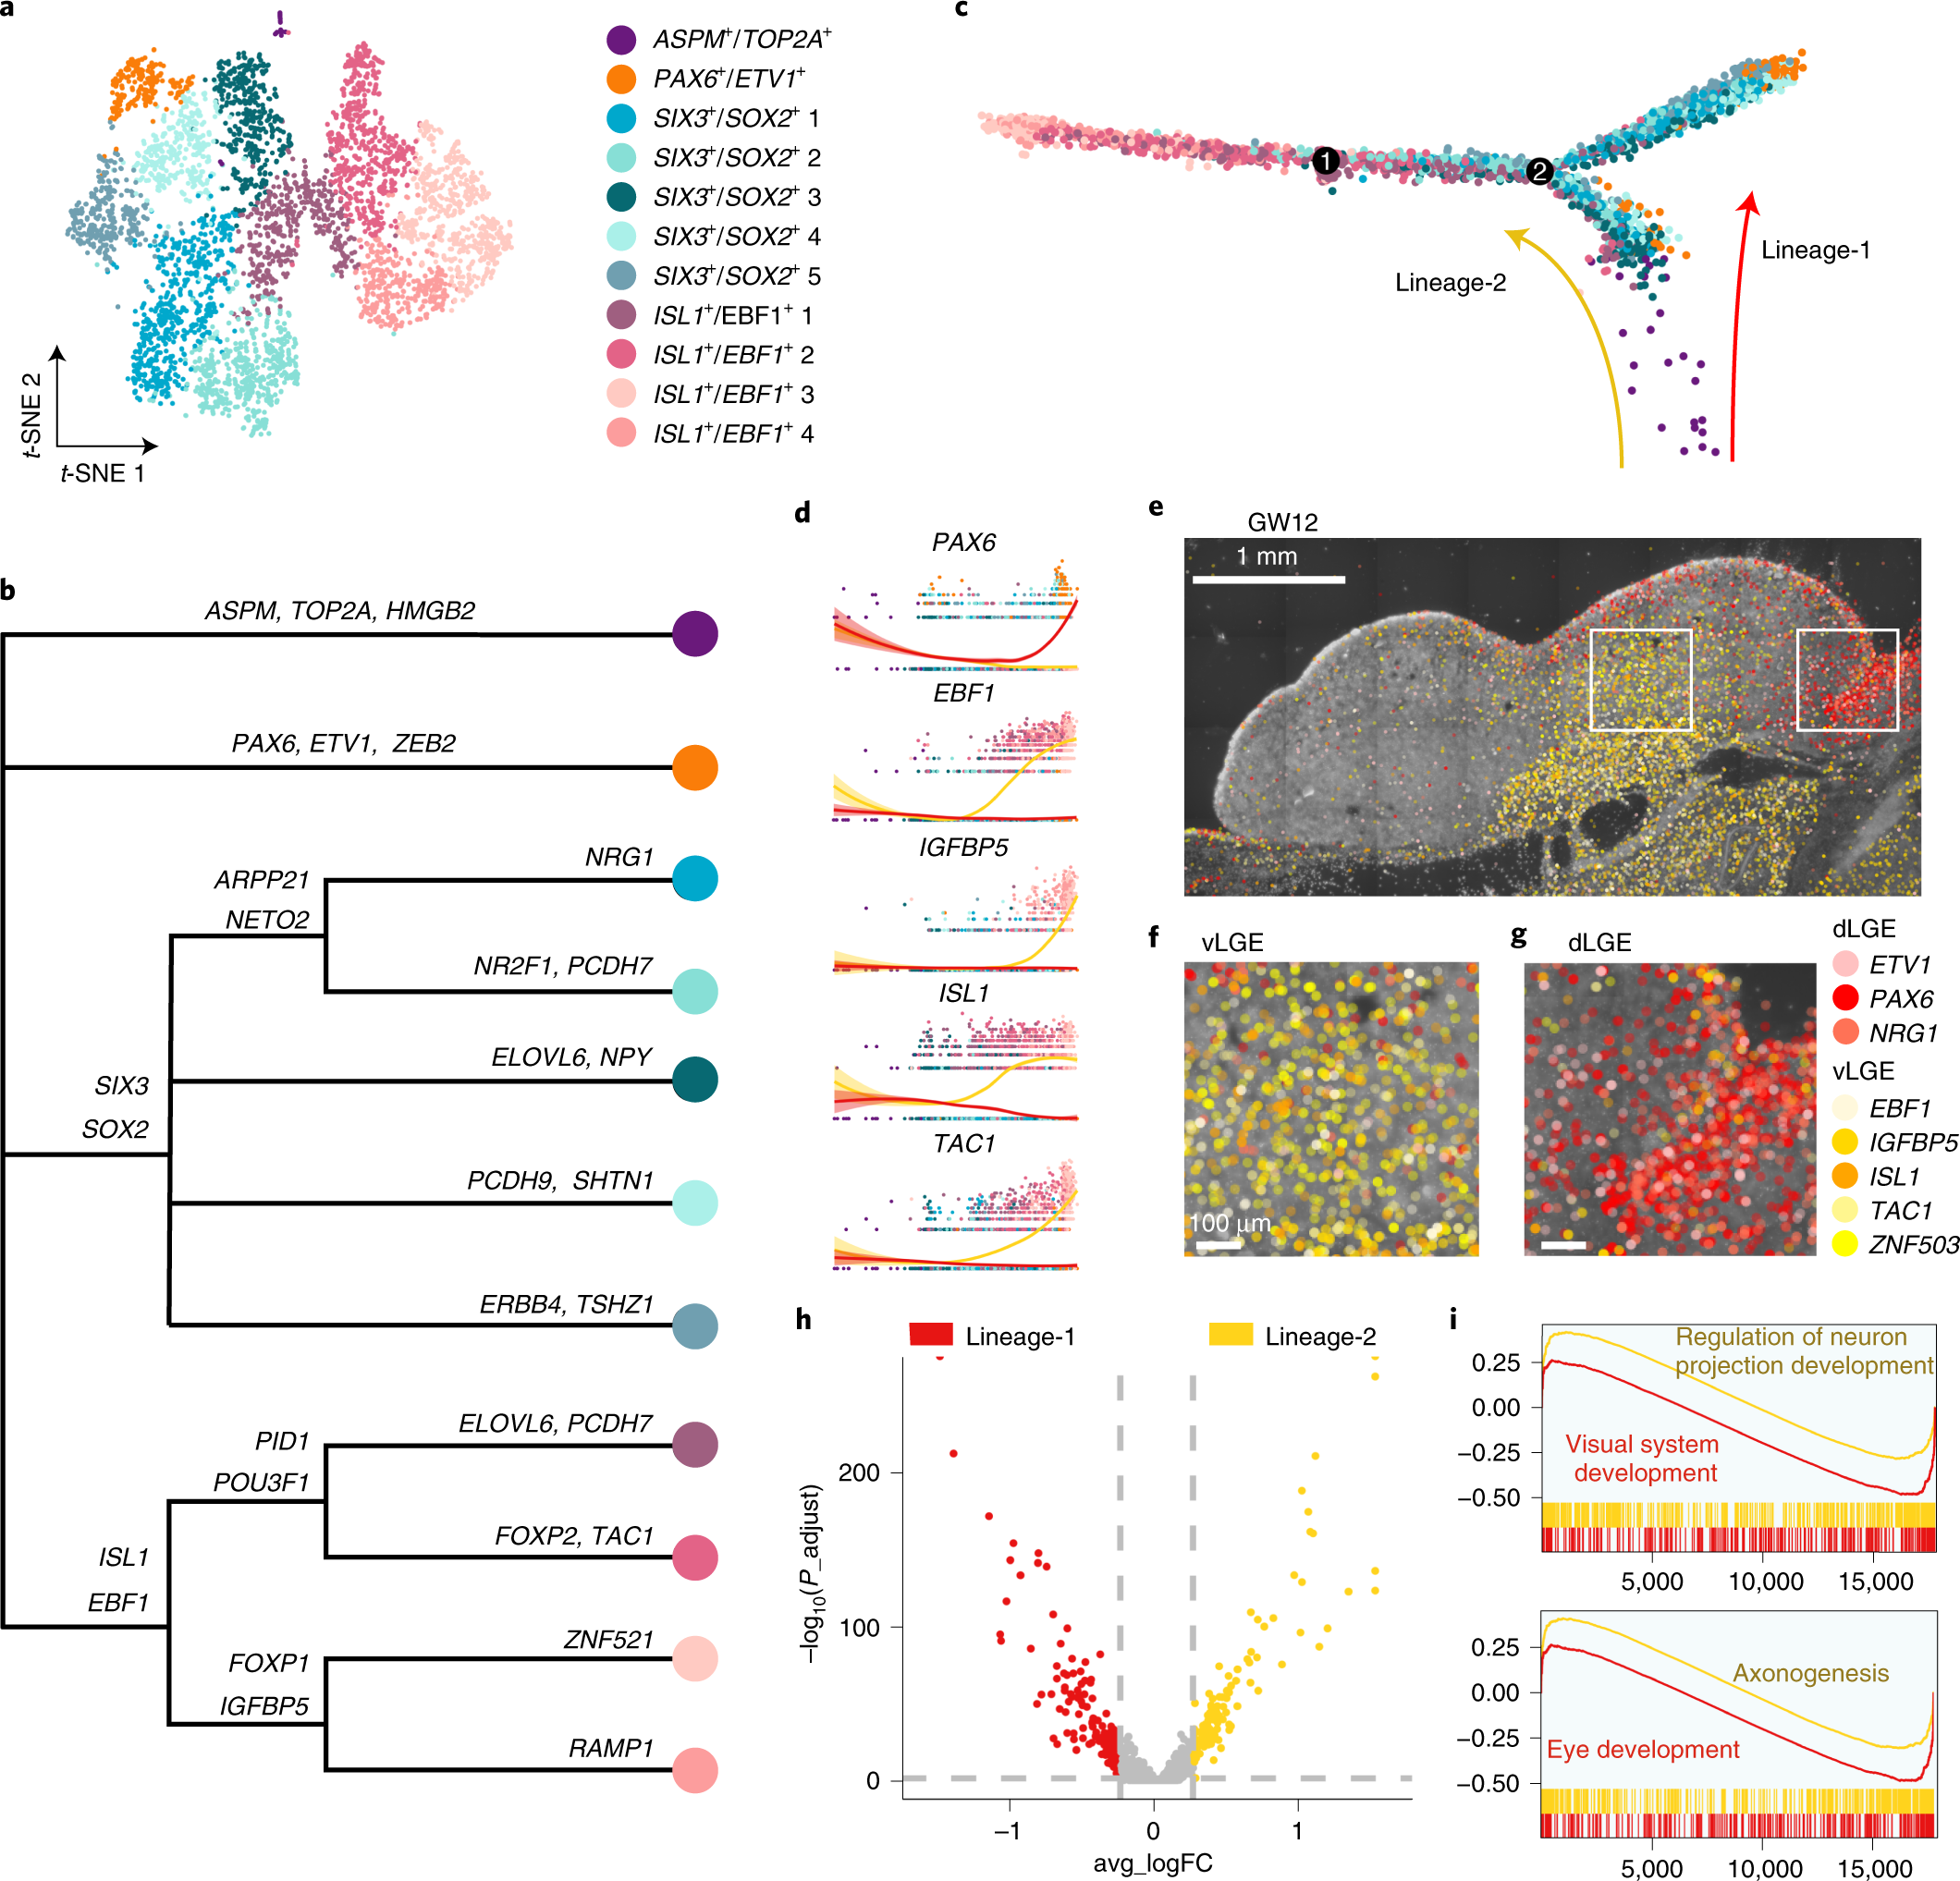
a, Clustering of LGE-derived interneuron precursors from GW9 and GW11 visualized by t-SNE embedding. b, Gene expression sets of subclusters of LGE-derived interneuron precursors. c, The developmental trajectory of LGE subclusters constructed using Monocle 2. Dots represent each cell; colored arrows represent constructed cell lineage-1 and lineage-2. d, Expression levels of LGE genes along with pseudotime. The red and yellow lines represent lineage-1 and lineage-2, respectively. The error bands are presented as mean ± s.e.m., and the level of confidence interval is 0.95. e–g, Expression patterns of eight LGE precursor marker genes in coronal sections of human fetal brains at GW12 as detected using ISS. The ventral and dorsal LGE (boxed areas in e) are shown in high-power views as vLGE (f) and dLGE (g). h, Volcano plot of differential expressions of genes from lineage-1 and lineage-2. i, The GSEA of GO biological processes, ranked genes from high to low by the values of log2 fold change. Adjusted P < 0.05. P values were adjusted using the Benjamini–Hochberg method. Scale bars, 1 mm in e; 100 µm in f and g. FC, fold change.
Fig. 6: Heterogeneity of CGE-derived interneuron precursors.
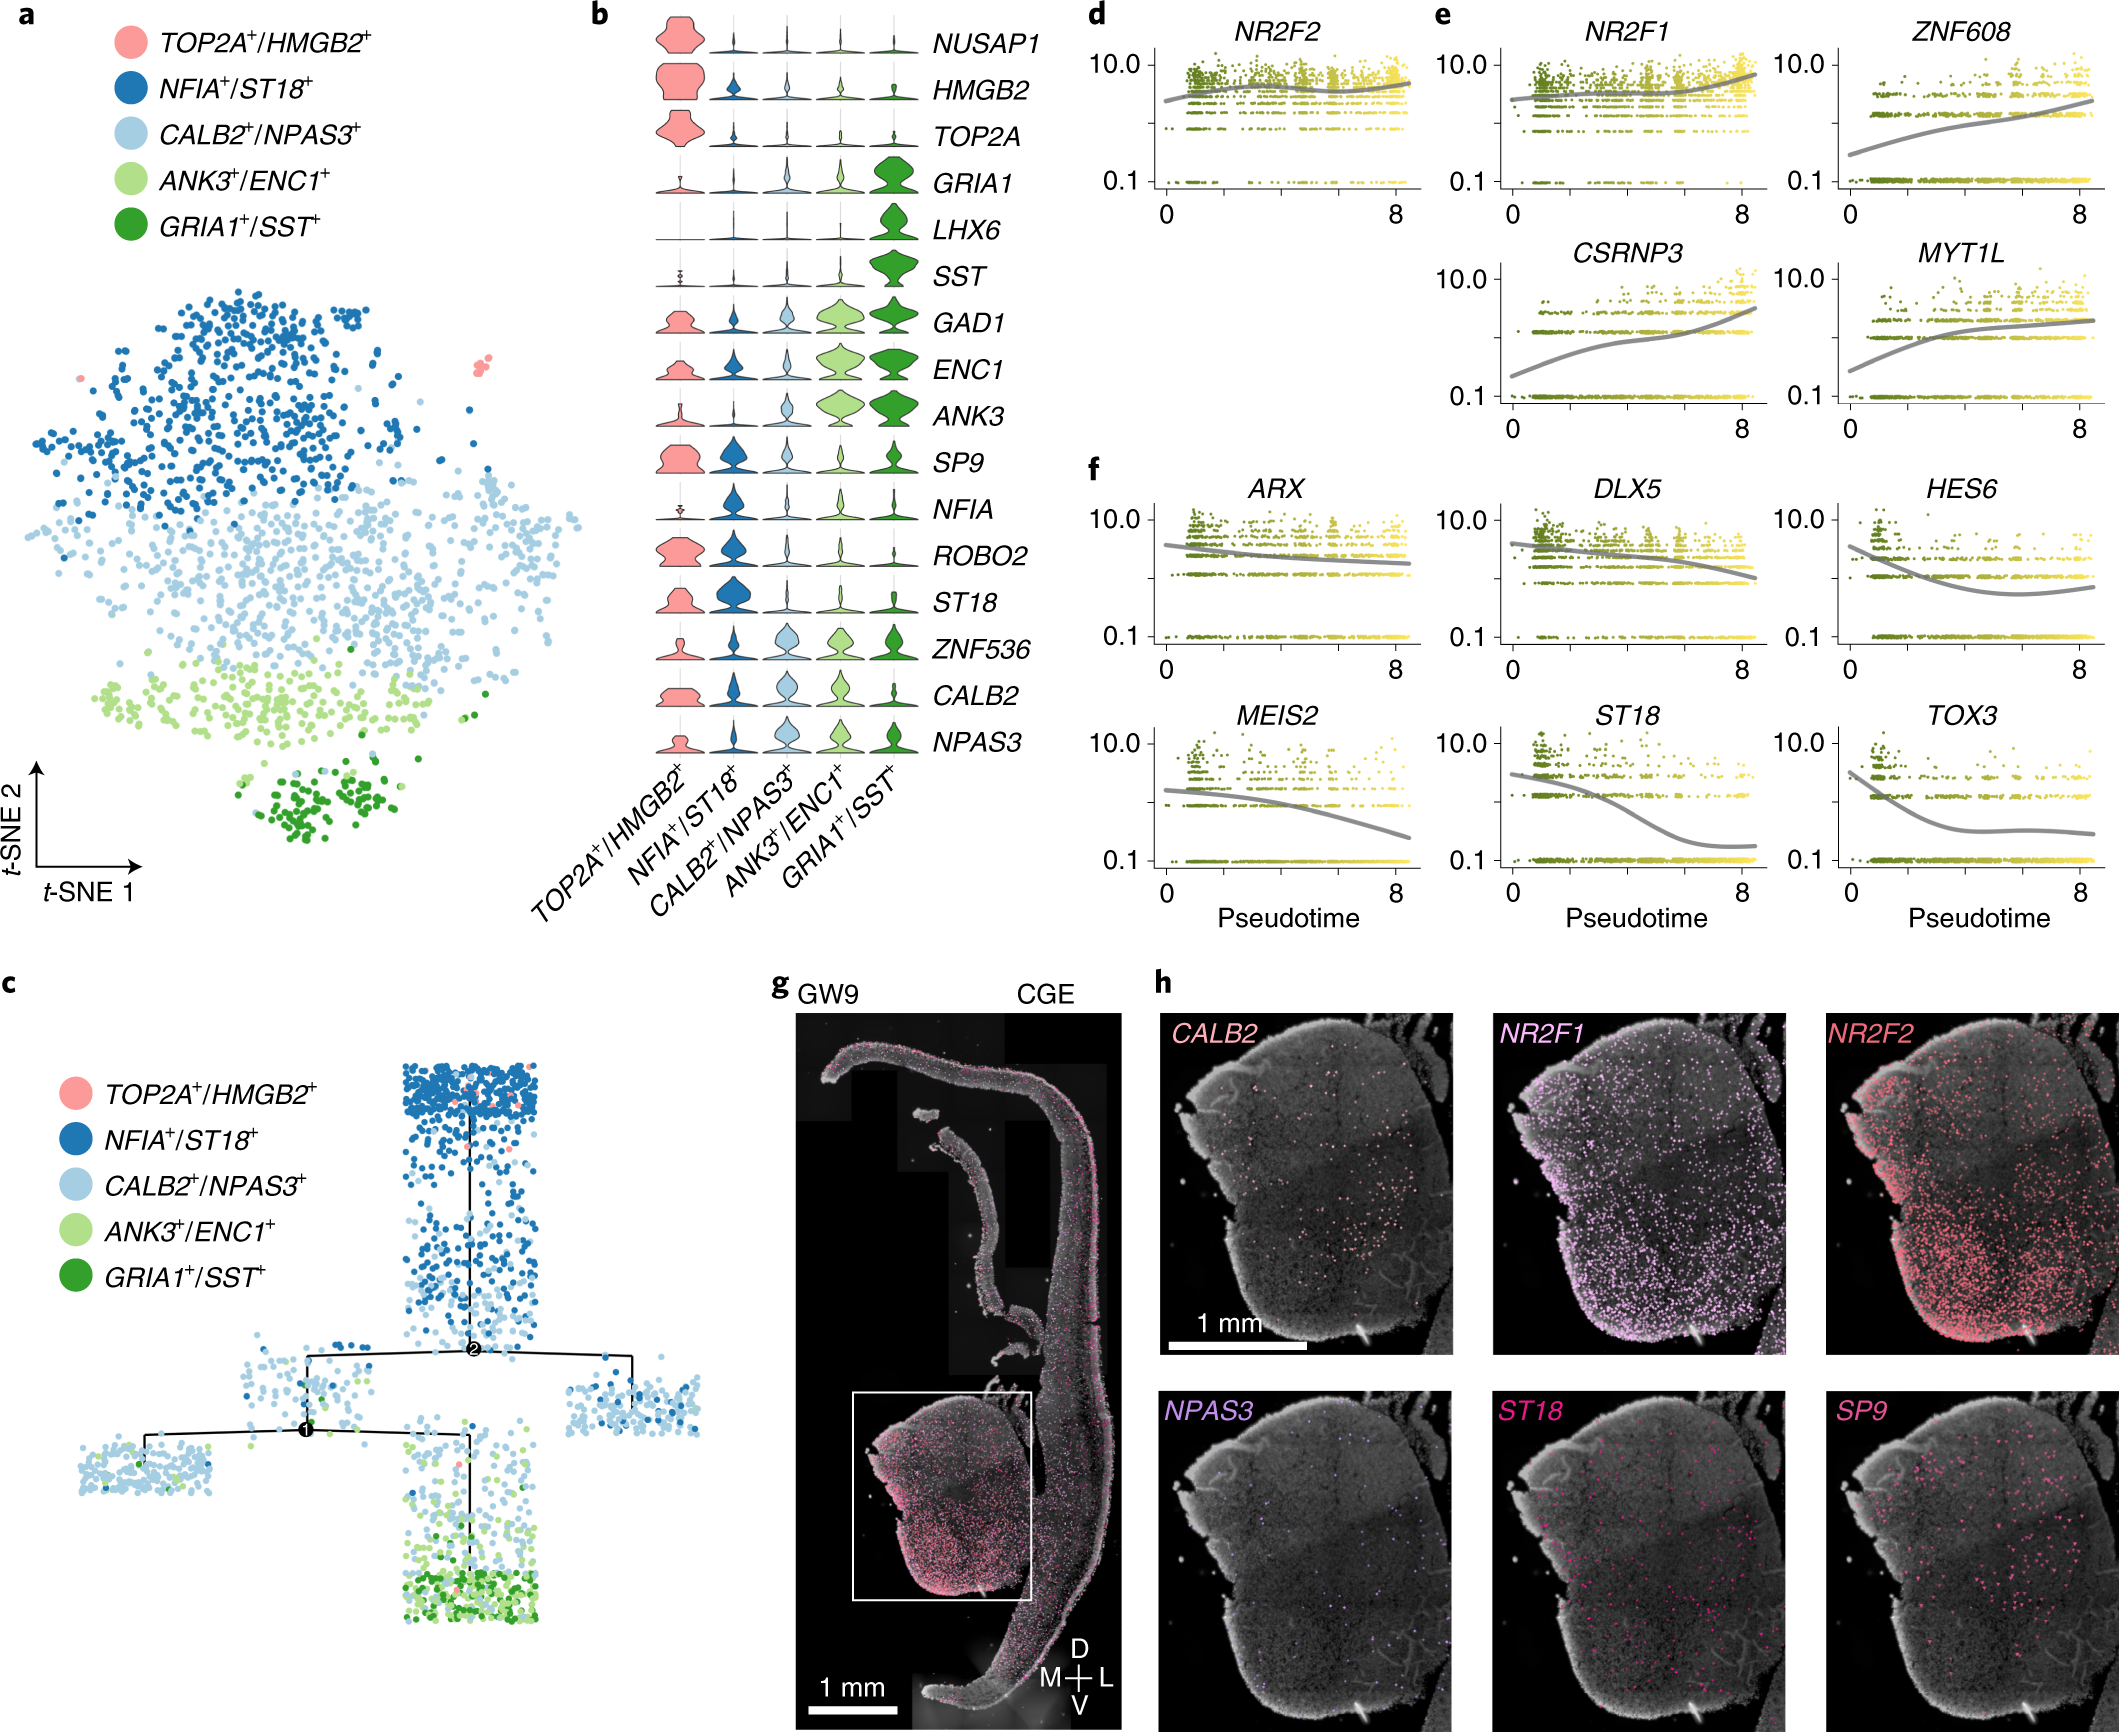
a, Clustering of CGE-derived interneuron precursors from GW9 and GW11 visualized by t-SNE embedding. b, Violin plot illustrating expression patterns of CGE marker genes in five subclusters. c, The pseudotime tree of five CGE subclusters. Dots represent each cell. d–f, The changes of expression levels of CGE-specific transcription factors along the pseudotime. The error bands are presented as mean ± s.e.m., and the level of confidence interval is 0.95. g, Expression patterns of six CGE precursor marker genes in coronal sections of human fetal brains at GW9 as detected using ISS. h, High-power views of gene expression in the CGE. Scale bars, 1 mm.
Fig. 7: Early acquisition of adult interneuron diversity in the human fetal subpallium.
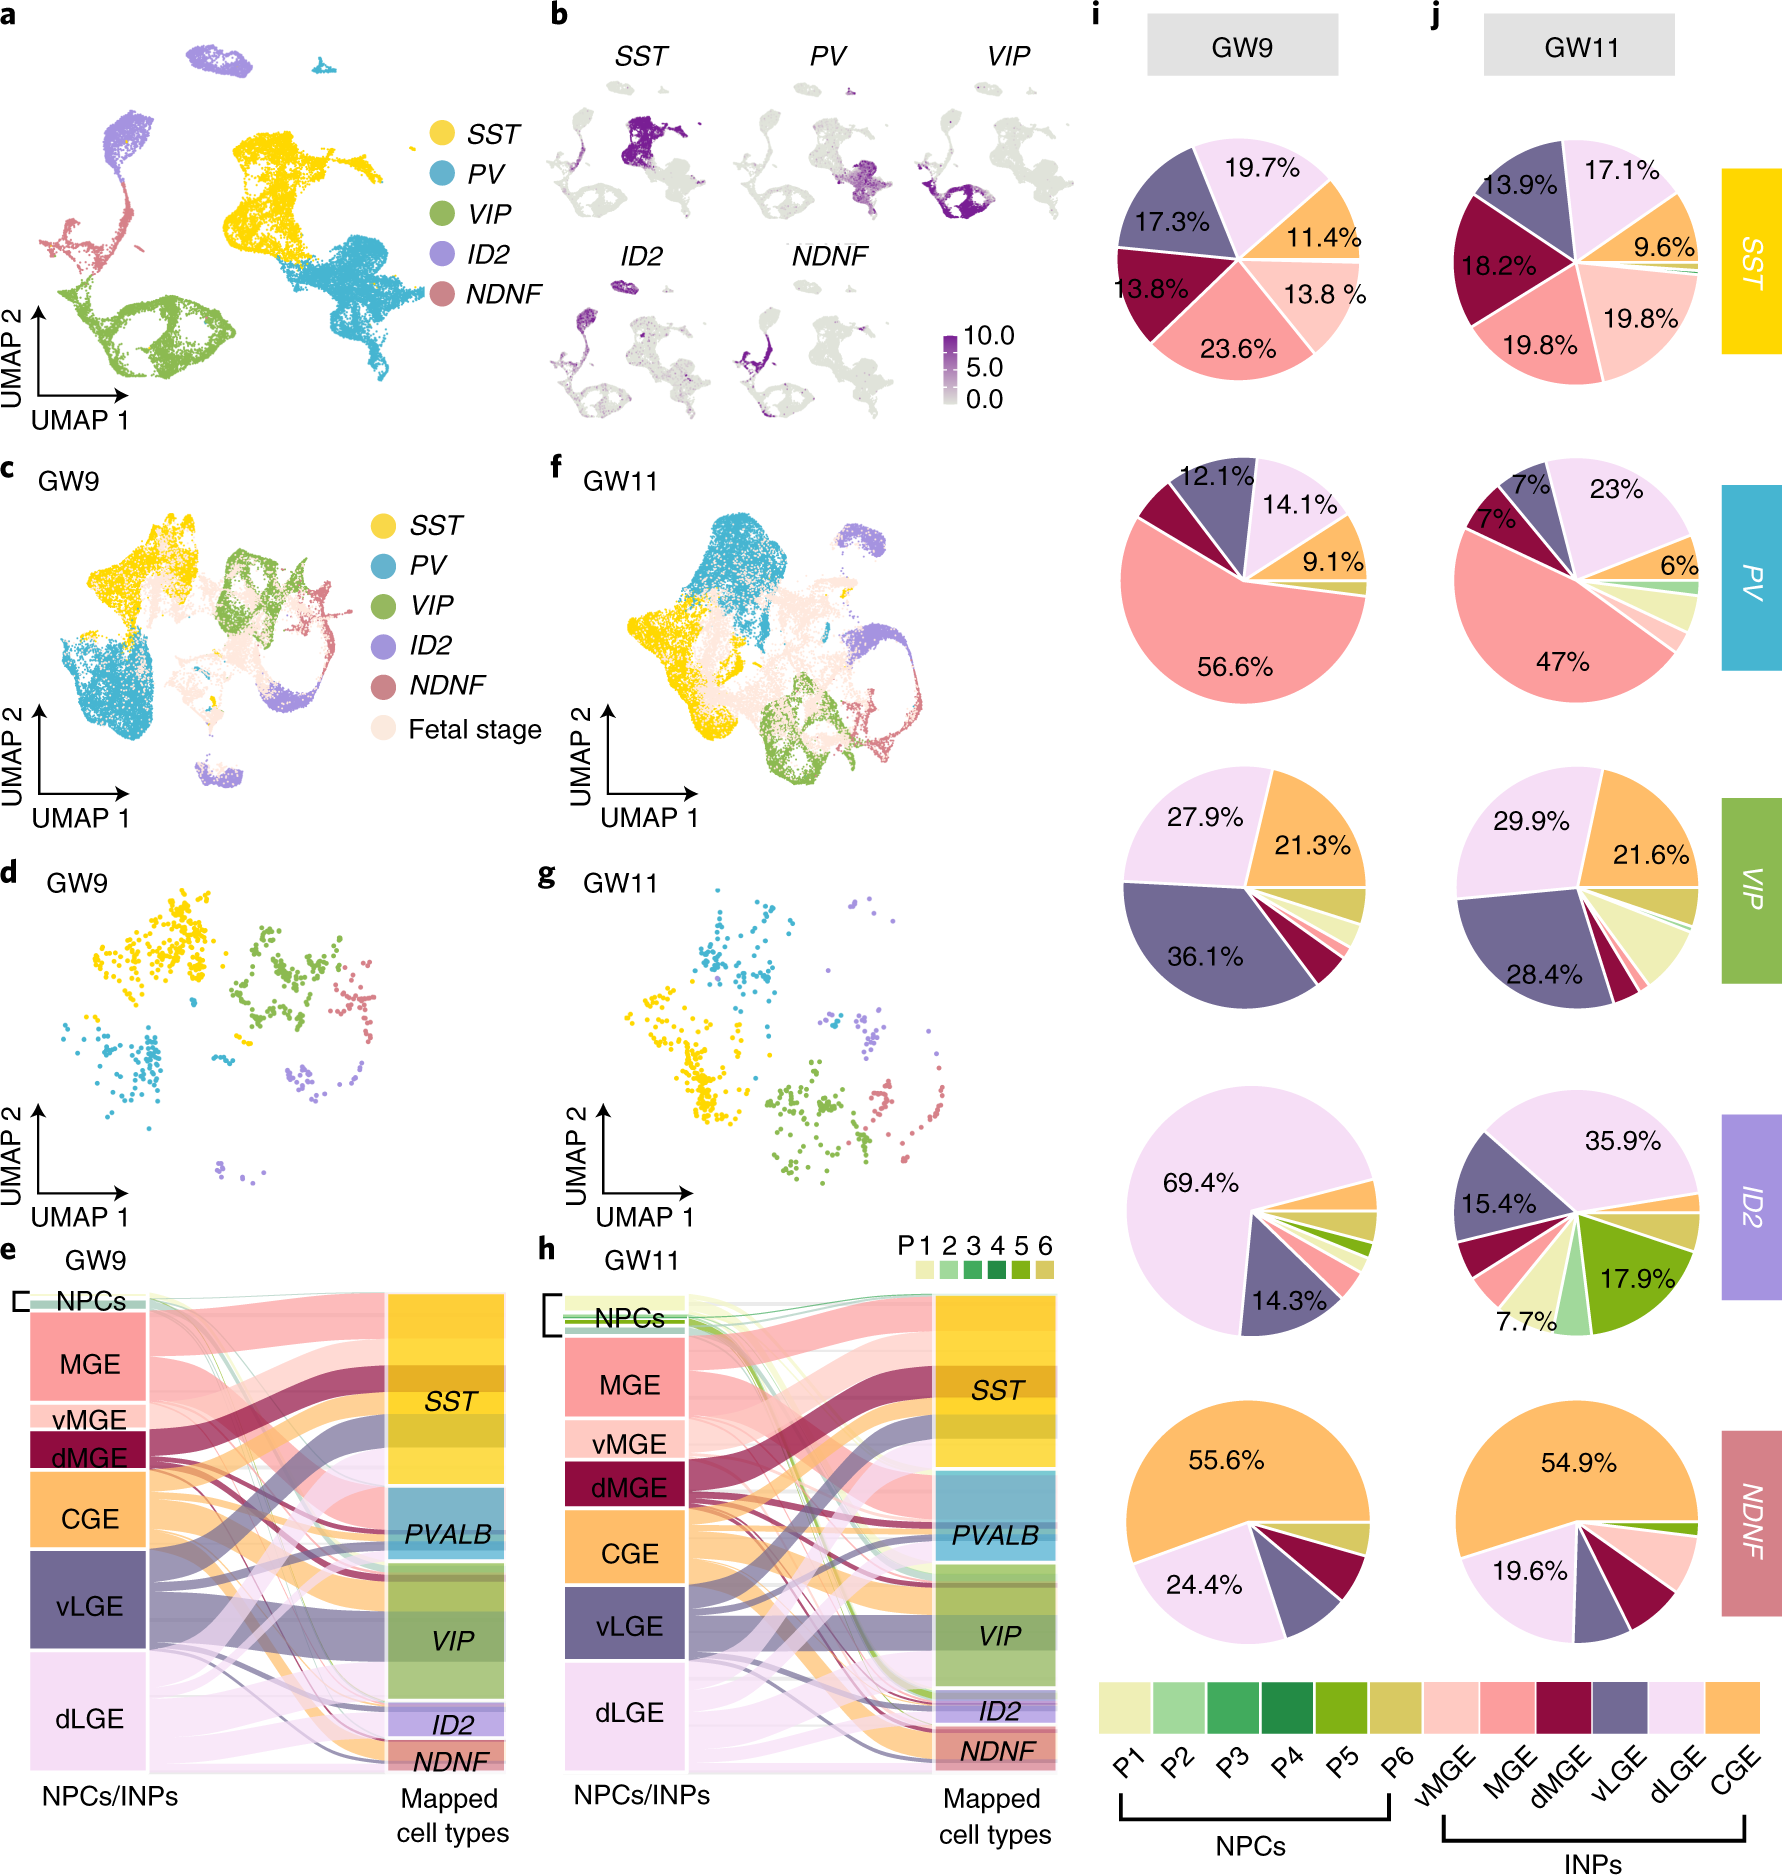
a, Clustering of five major types of interneurons based on datasets from the human adult primary motor cortex (M1). b, Distribution patterns of genes expressed in five types of interneurons visualized by uniform manifold approximation and projection (UMAP). c, f, Mapped INPs from the human fetal subpallium at GW9 (c) and GW11 (f) were integrated with those five types of cells in the human adult M1. Different colors represent different adult cell types. Pink color represents cells in fetal stages. d, g, INP cells in the subpallium at GW9 (d) and GW11 (g) colored by five major adult interneuron cell types. e, h, Alluvial plots illustrating the origin of five major types of adult interneurons from the NPCs (P1–P6) and INPs in the MGE, LGE and CGE of the human fetal subpallium. i, j, The percentages of five major types of adult interneurons that are derived from the MGE, LGE and CGE in the human fetal subpallium at GW9 (i) and GW11(j).
Extended Data Fig. 1: Single-cell transcriptomic maps of the human fetal subpallium.
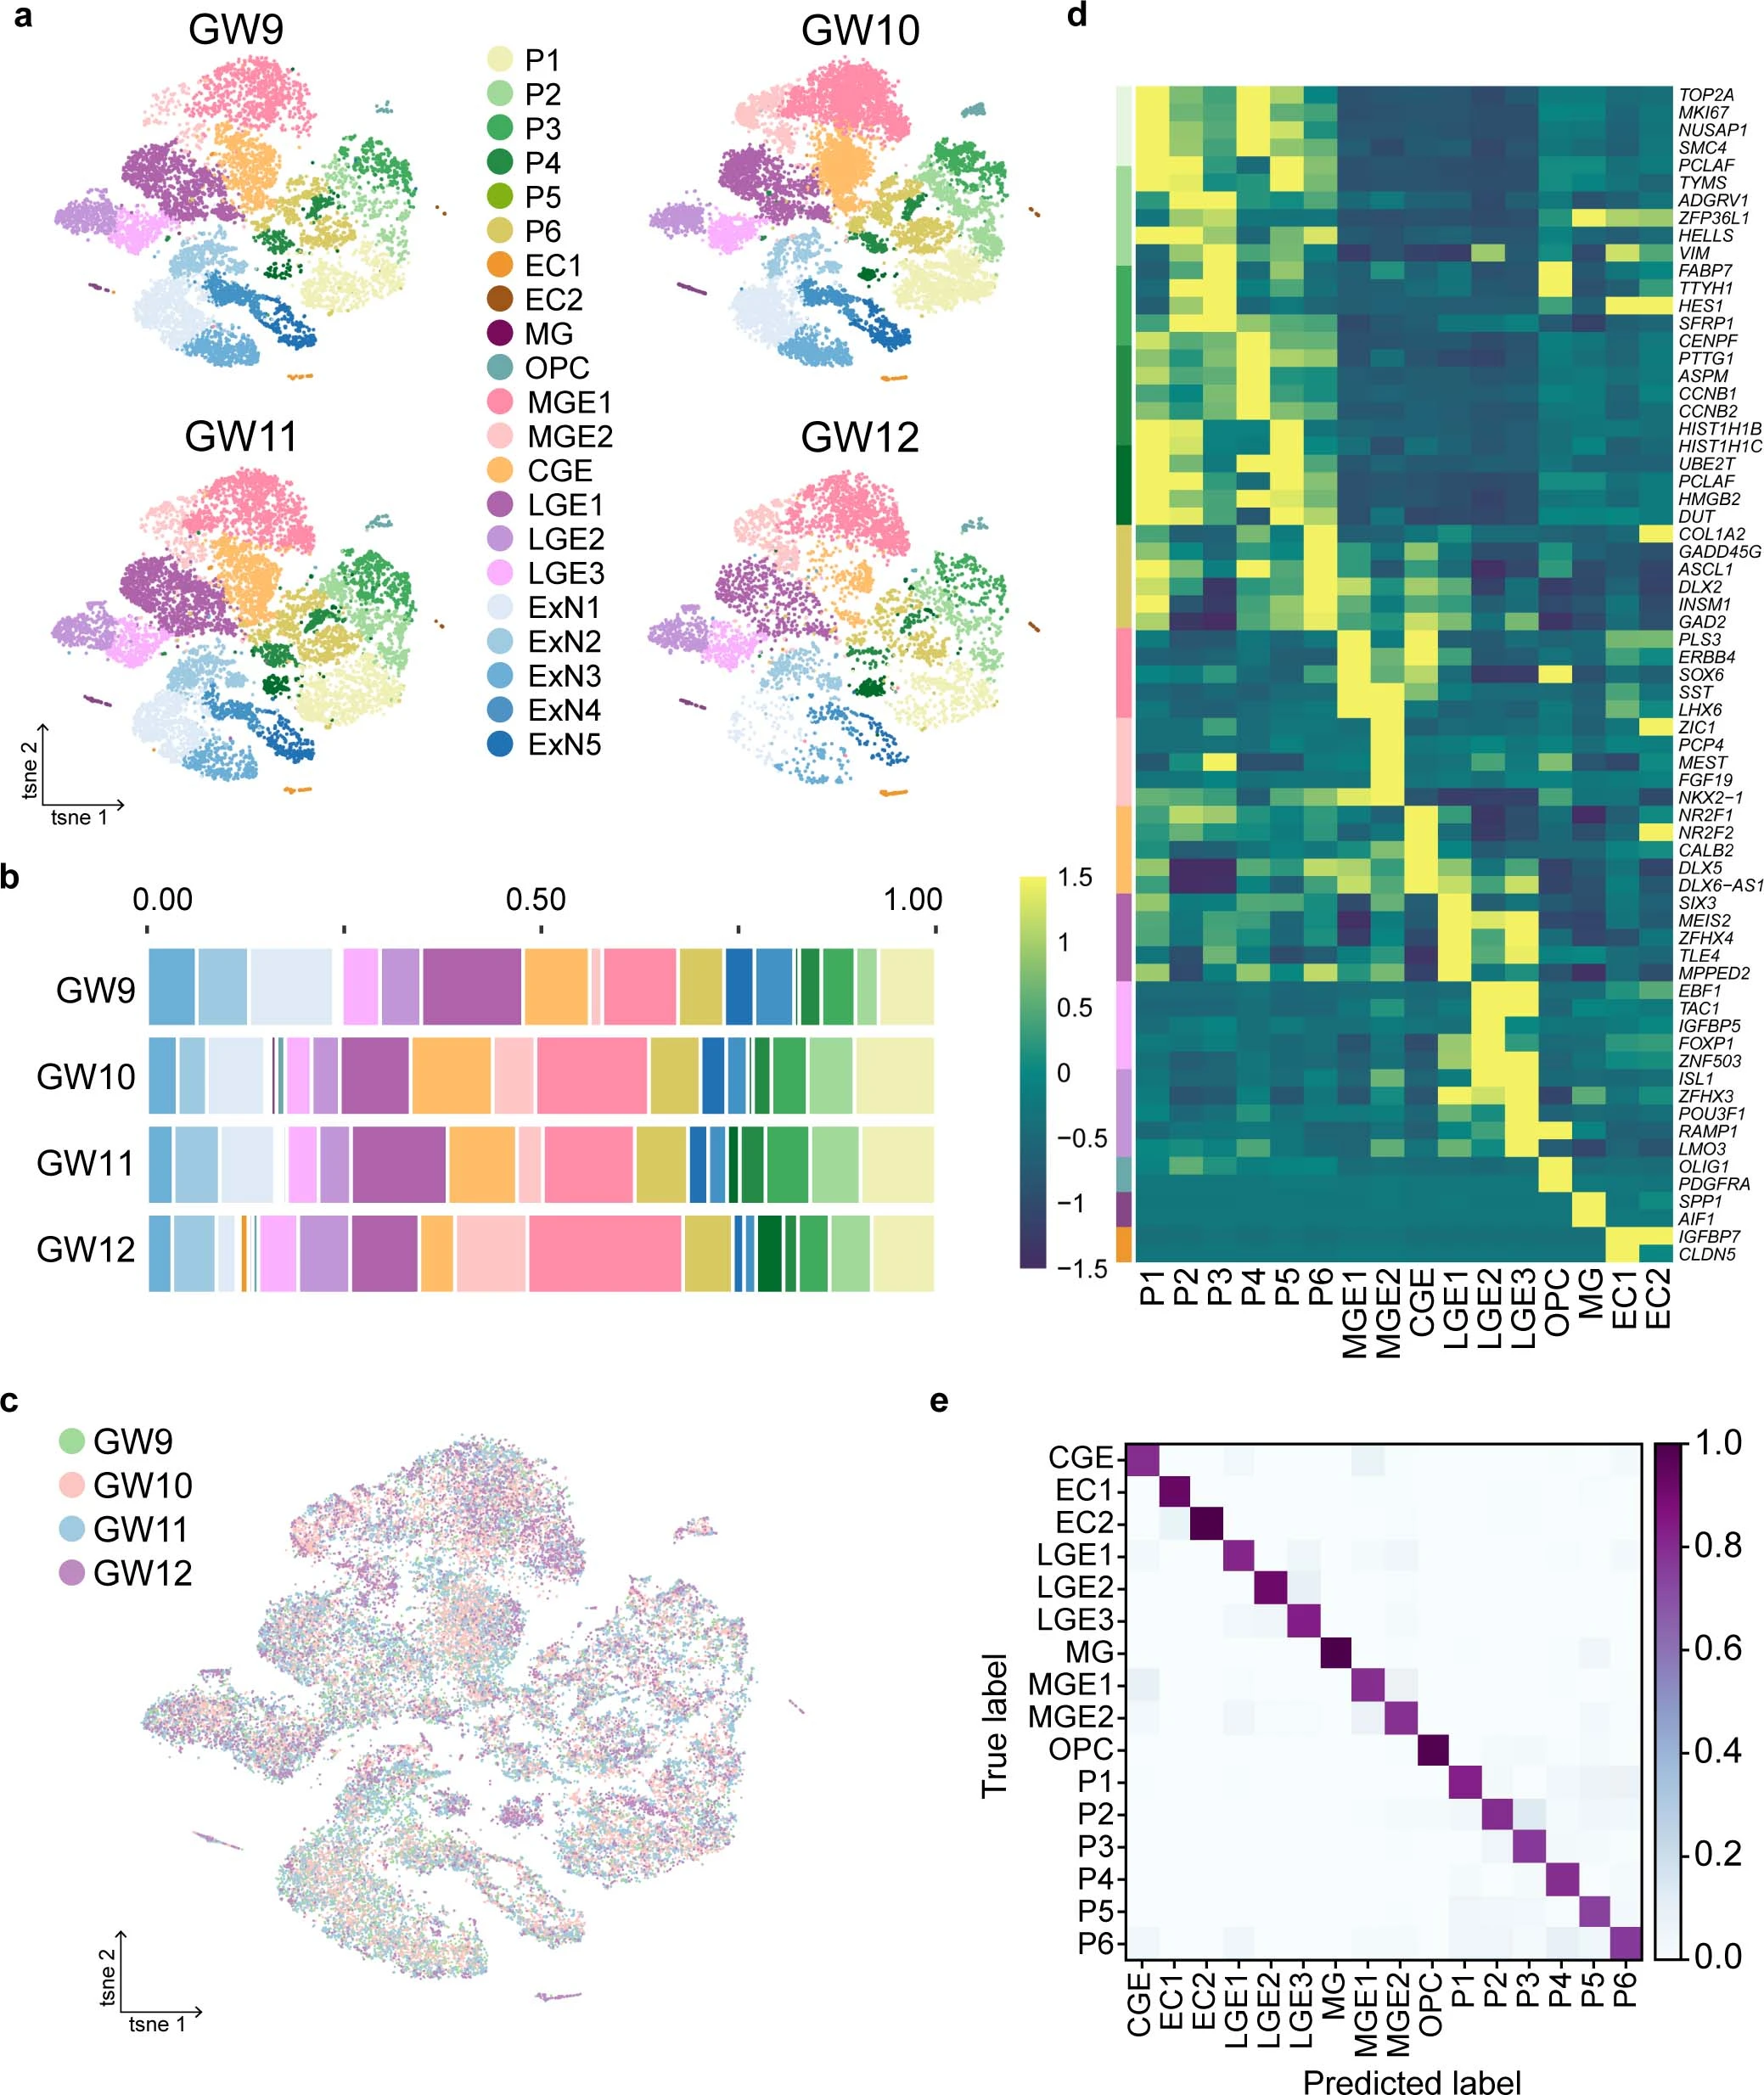
a, Cell clustering of human fetal subpallial samples at gestational weeks (GW) 9 to 12 integrated using harmony and depicted using t-SNE. b, The distribution of each subclusters in the subpallium at four developing stages. Colors indicate cell clusters as shown in a. c, Clustering of all cells from four developing stages after batch correction visualized using t-SNE. d, Heatmap illustrating differentially expressed genes (DEGs) in five major clusters and 17 subclusters. e, Assessment of 71 genes from 2,922 DEGs using Random Forest Classifier from scikit-learn of the remaining 16 subclusters after removing excitatory lineages. ‘True label’ indicates the manual annotation based on the 71 genes.
Extended Data Fig. 2: Expression patterns of canonical genes from each cell types.

a-f, Representative genes expressed in cell clusters from human fetal subpallium visualized using t-SNE. Each dot represents one cell. Major clusters include excitatory lineages (a), neural progenitor cells (NPCs, b) and interneuron precursors (INPs, c) derived from the medial ganglionic eminence (MGE_INPs, d), caudal ganglionic eminence (CGE_INPs, e) and lateral ganglionic eminence (LGE_INPs, f).
Extended Data Fig. 3: Heterogeneity of interneuron progenitors in the human fetal subpallium.

a-c, Expression of DLX2 and GAD2 at gestational weeks (GW) 9 (a), GW11 (b), GW12 (c), visualized by the t-SNE plot. d, Violin plots of expression patterns of progenitor markers expressed at the ventricular zone (VZ) and subventricular zone (SVZ) in the subpallium at GW12. e, Violin plots of expression patterns of ganglionic eminence regional markers in the progenitors from GW9 to GW12.
Extended Data Fig. 4: Expression patterns of subpallial genes in the ganglionic eminence of the human fetal brain as detected by in situ sequencing (ISS).

a and b, Expression patterns of 6 subpallial genes in the medial ganglionic eminence (MGE) (a), lateral ganglionic eminence (LGE) (a) and caudal ganglionic eminence (CGE) (b) at gestational week 12 (GW12). c-e, Boxed areas in a and b are shown in high power views. Scale bars: 1 mm in a and b; 100 µm in c-e.
Extended Data Fig. 5: Expression patterns of genes in the subpallium of the human fetal brain as detected by in situ sequencing (ISS).

a-d, Expression patterns of genes expressed in the ventricular zone (VZ) and subventricular zone (SVZ) at gestational week 12 (GW12) are shown in green and purple pseudo-colors, respectively, in the medial ganglionic eminence (MGE), lateral ganglionic eminence (LGE) and caudal ganglionic eminence (CGE). Scale bars: 1 mm.
Extended Data Fig. 6: Expression patterns of genes expressed in the ventricular zone (VZ) in the subpallium of the human fetal brain as detected by in situ sequencing (ISS).
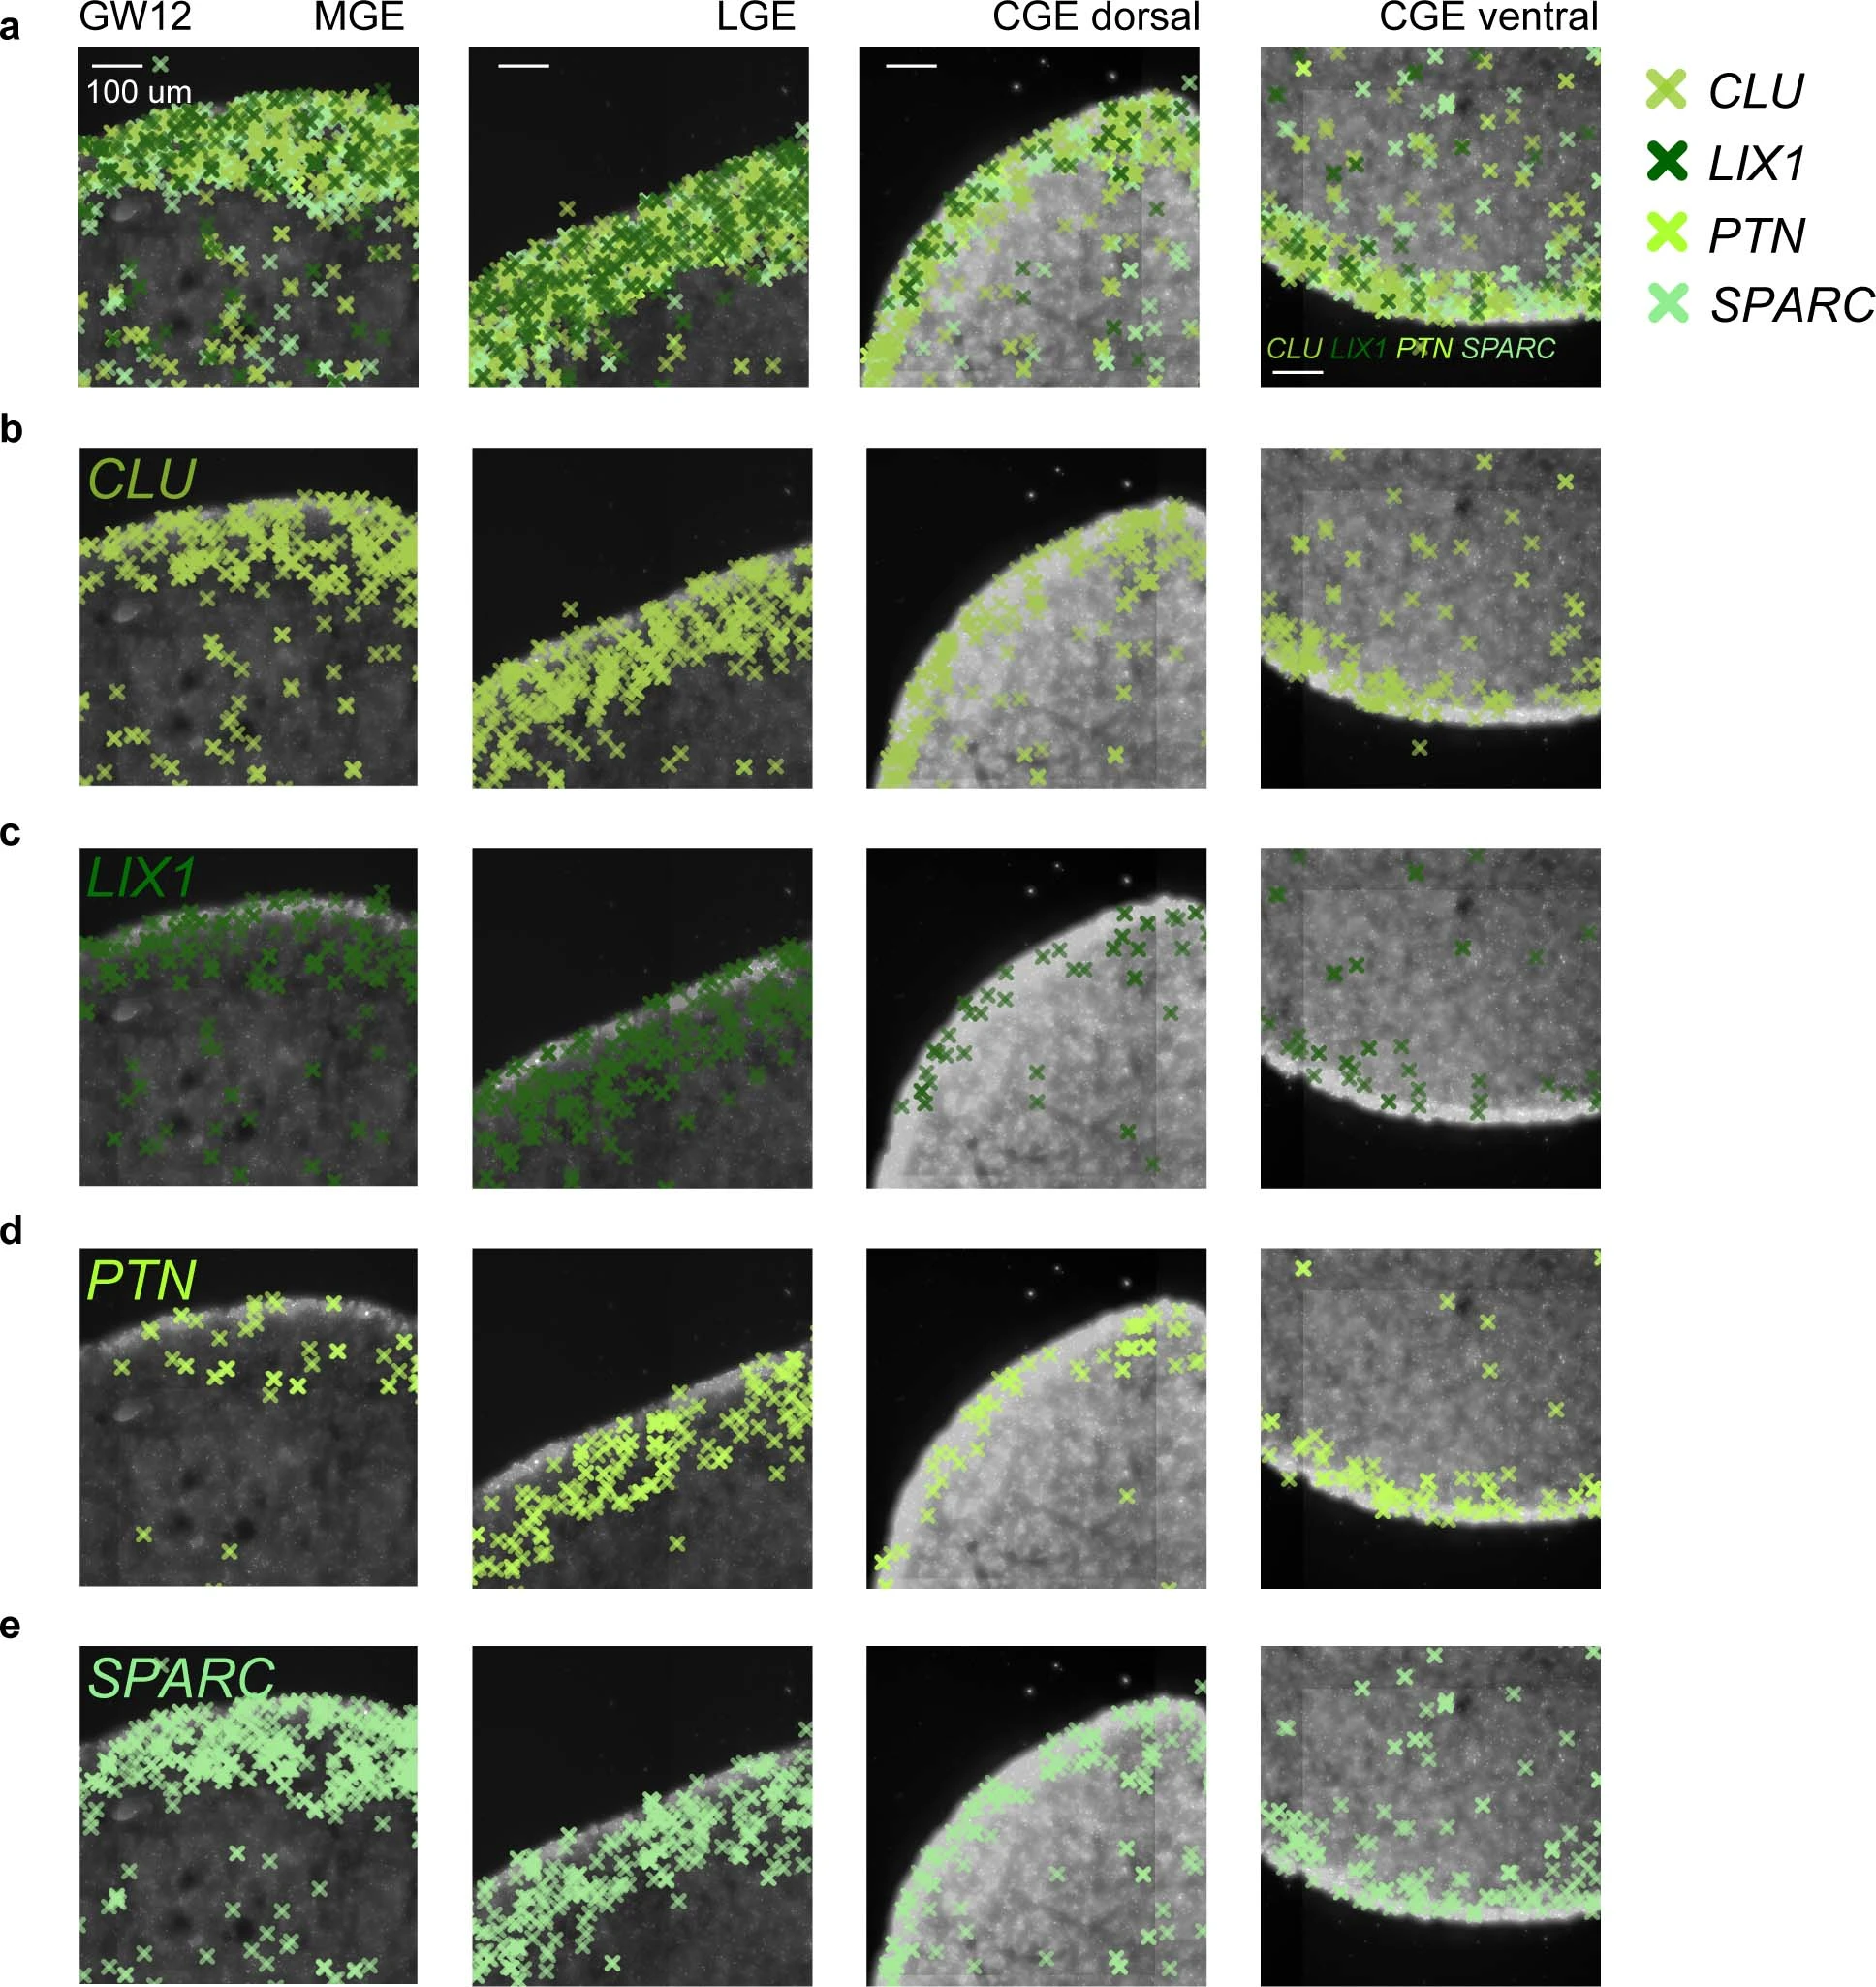
a, Merged expression of CLU, LIX1, PTN and SPARC in the medial ganglionic eminence (MGE), lateral ganglionic eminence (LGE) and caudal ganglionic eminence (CGE) at gestational week 12 (GW12). b-e, Expression of CLU (b), LIX1 (c), PTN (d) and SPARC (e) in the MGE, LGE and CGE. Scale bars: 100 µm.
Extended Data Fig. 7: Specification of medial ganglionic eminence (MGE)-derived interneuron precursors.
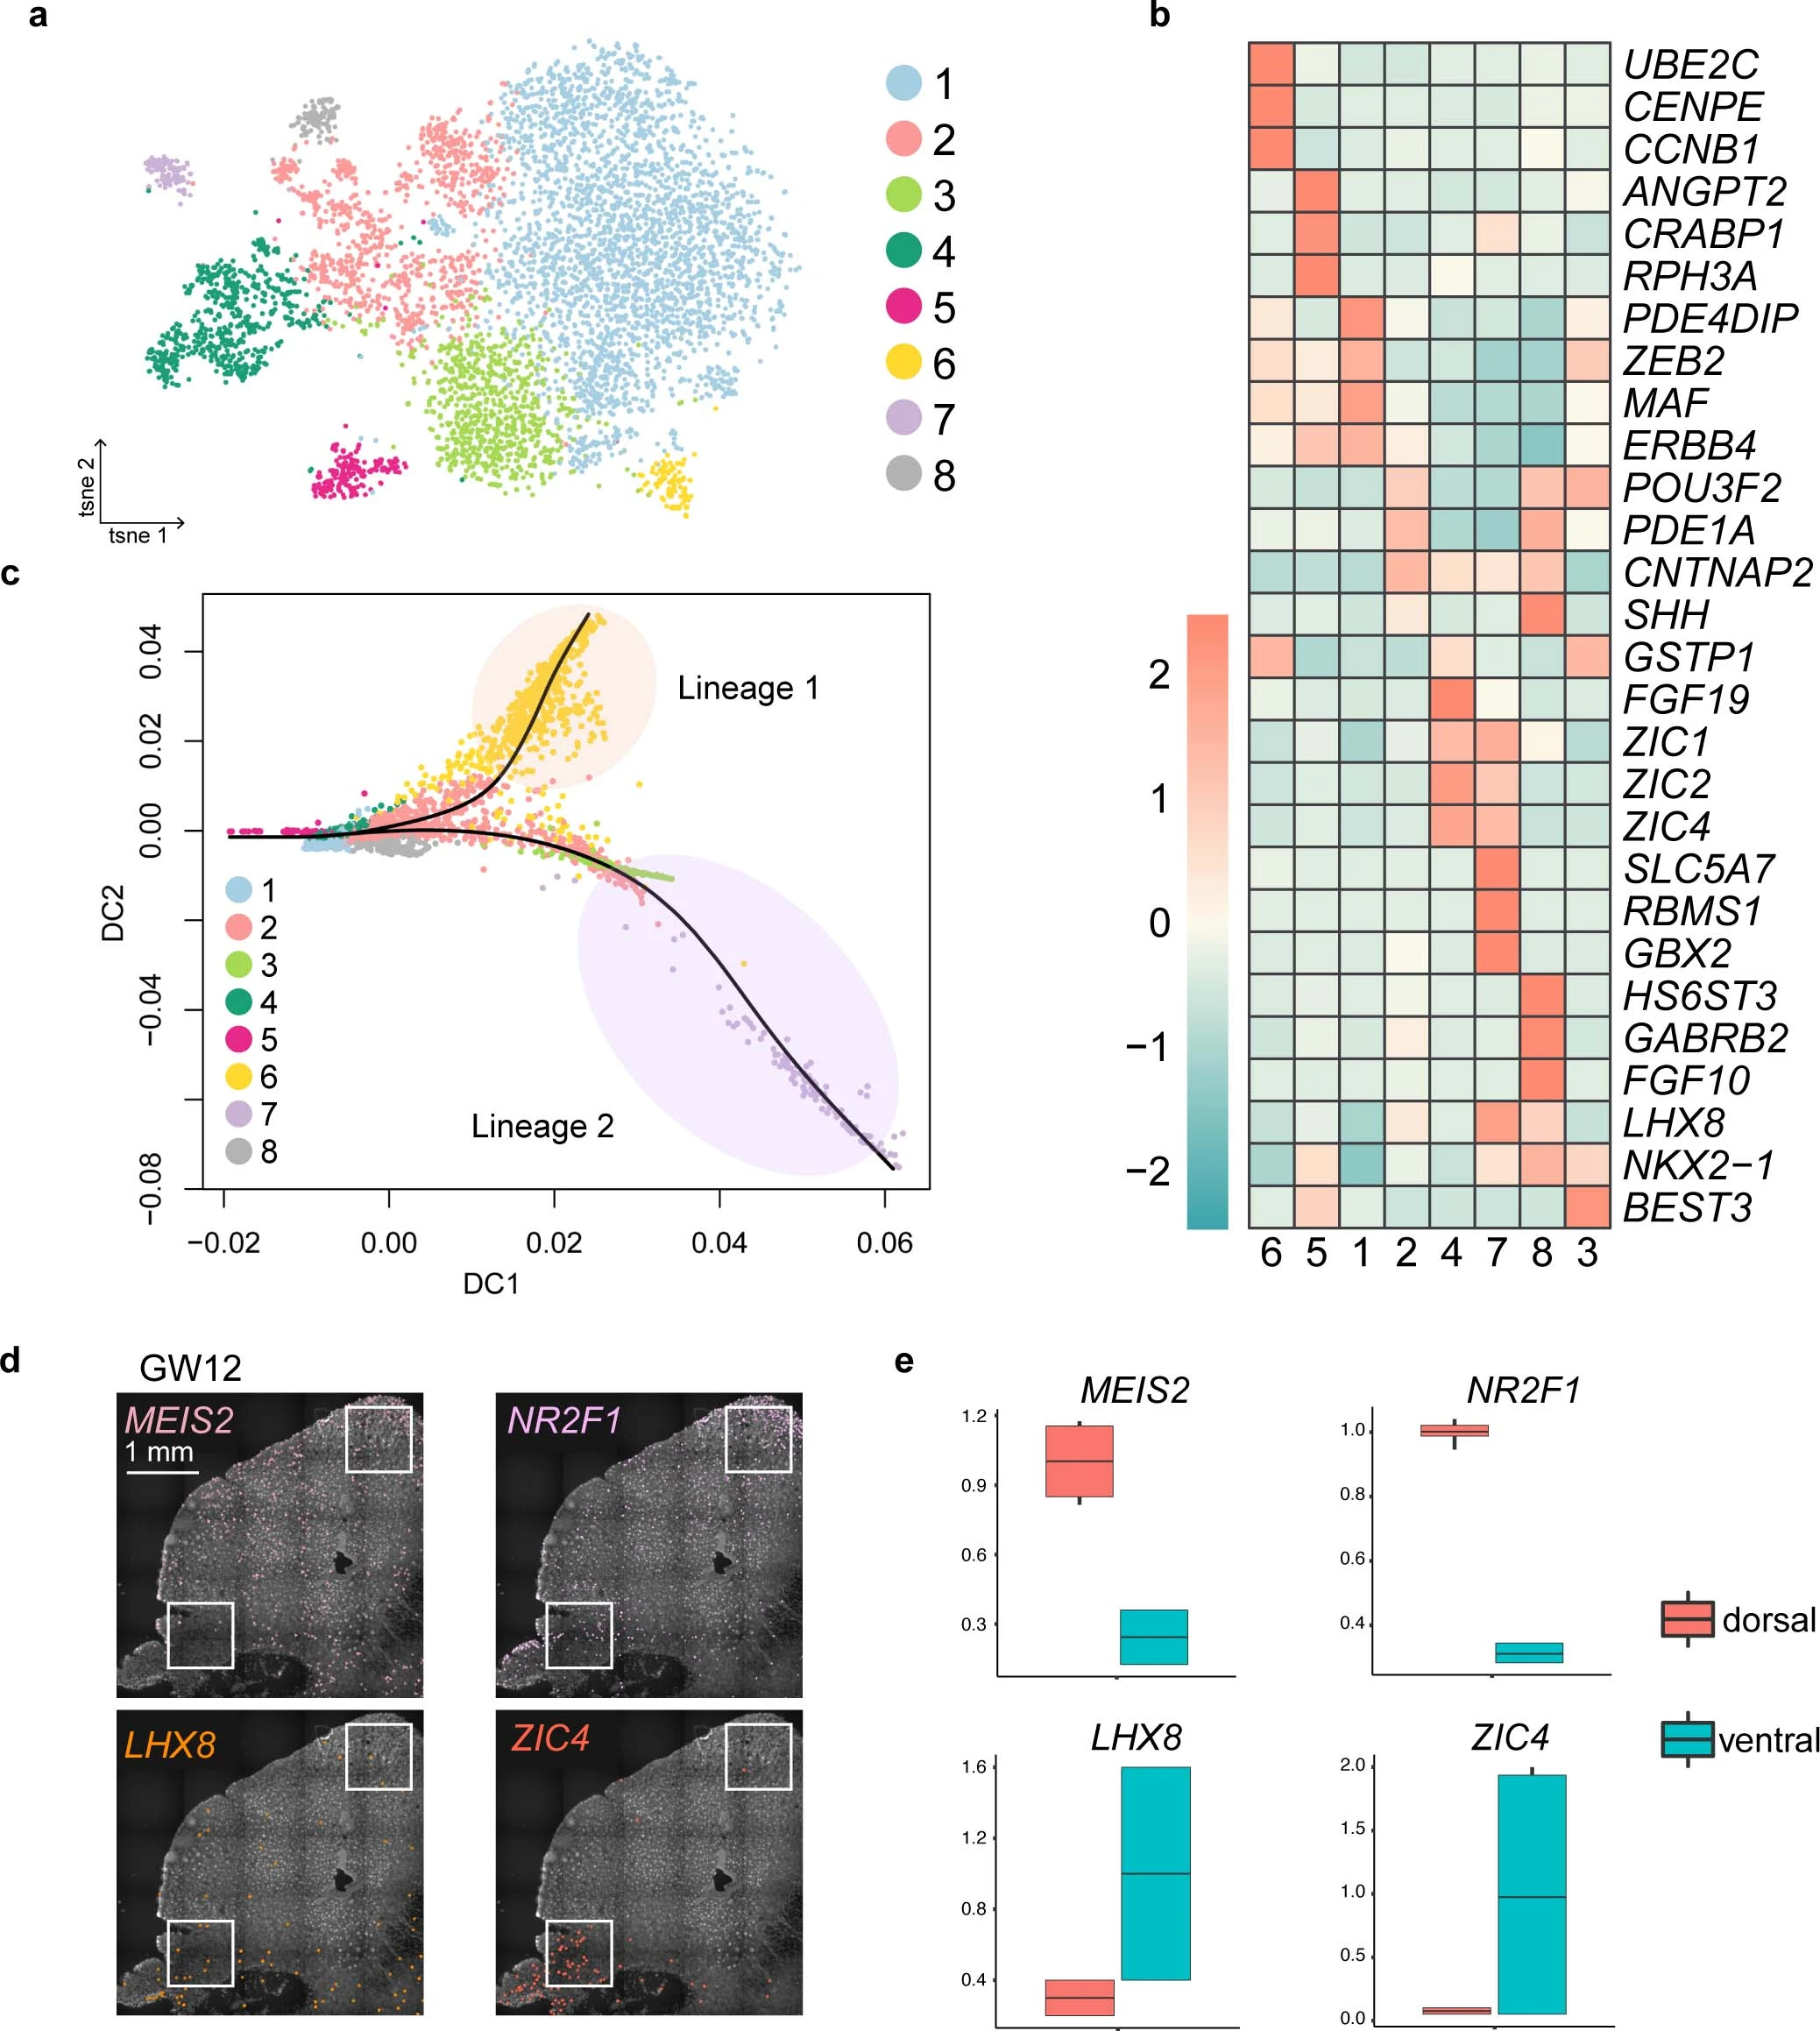
a, Clustering of MGE-derived interneuron precursors from GW9 to GW12 visualized by t-SNE embedding. Cluster 5, 1, 2, 4 and 7 were similar to ANGPT2+/CRABP1+, ZEB2+/MAF+, POU3F2+/CNTNAP2+, NR2F1+/MEIS2+ and LHX8+/NKX2-1+, respectively, in the Fig. 4a, cluster 3, 6, 8 were raised from the GW12. b, Heatmap of differentially expressed genes from subclusters in a. c, Diffusion map of the most variable genes and reconstruction of the cell lineages. Dots represent cells, and black lines represent predicted cell lineage-1 and -2. As examples, the cluster 6 was predicted to the lineage 1 and the cluster 3 to the lineage 2. d. Expression patterns of genes highly expressed in the dorsal (MEIS2 and NR2F1) and ventral (LHX8 and ZIC4) MGE in human fetal brains at gestational week 12 (GW12) as detected using in situ sequencing (ISS). e, Box plots representing relative numbers of positive dots of MGE marker genes in boxed areas in the dorsal and ventral MGE in d. Box: 25–75th percentiles, whiskers: 10–90th percentiles, horizontal line in box: median. Scale bars: 1 mm.
Extended Data Fig. 8: Expression patterns of medial ganglionic eminence (MGE) specific genes of the human fetal brain as detected by in situ sequencing (ISS).

a, Coronal sections labeled with DAPI to illustrate cell nucleoli of a human fetal brain at gestational week 12 (GW12). Boxed areas highlight the MGE. The dorsal (D), ventral (V), medial (M) and lateral (L) orientations of the sections are labeled. b, High expression of CNTNAP2 and MAF at the root of lineage-1 and -2 based on the diffusion map in lineage analyses. c-e, Expression patterns of 10 MGE-precursor marker genes in coronal sections of human fetal brains. The dorsal and ventral MGEs are labeled as dMGE (c) and vMGE (d). Scale bars: 1 mm.
Extended Data Fig. 9: Lateral ganglionic eminence (LGE)-derived interneuron precursors.
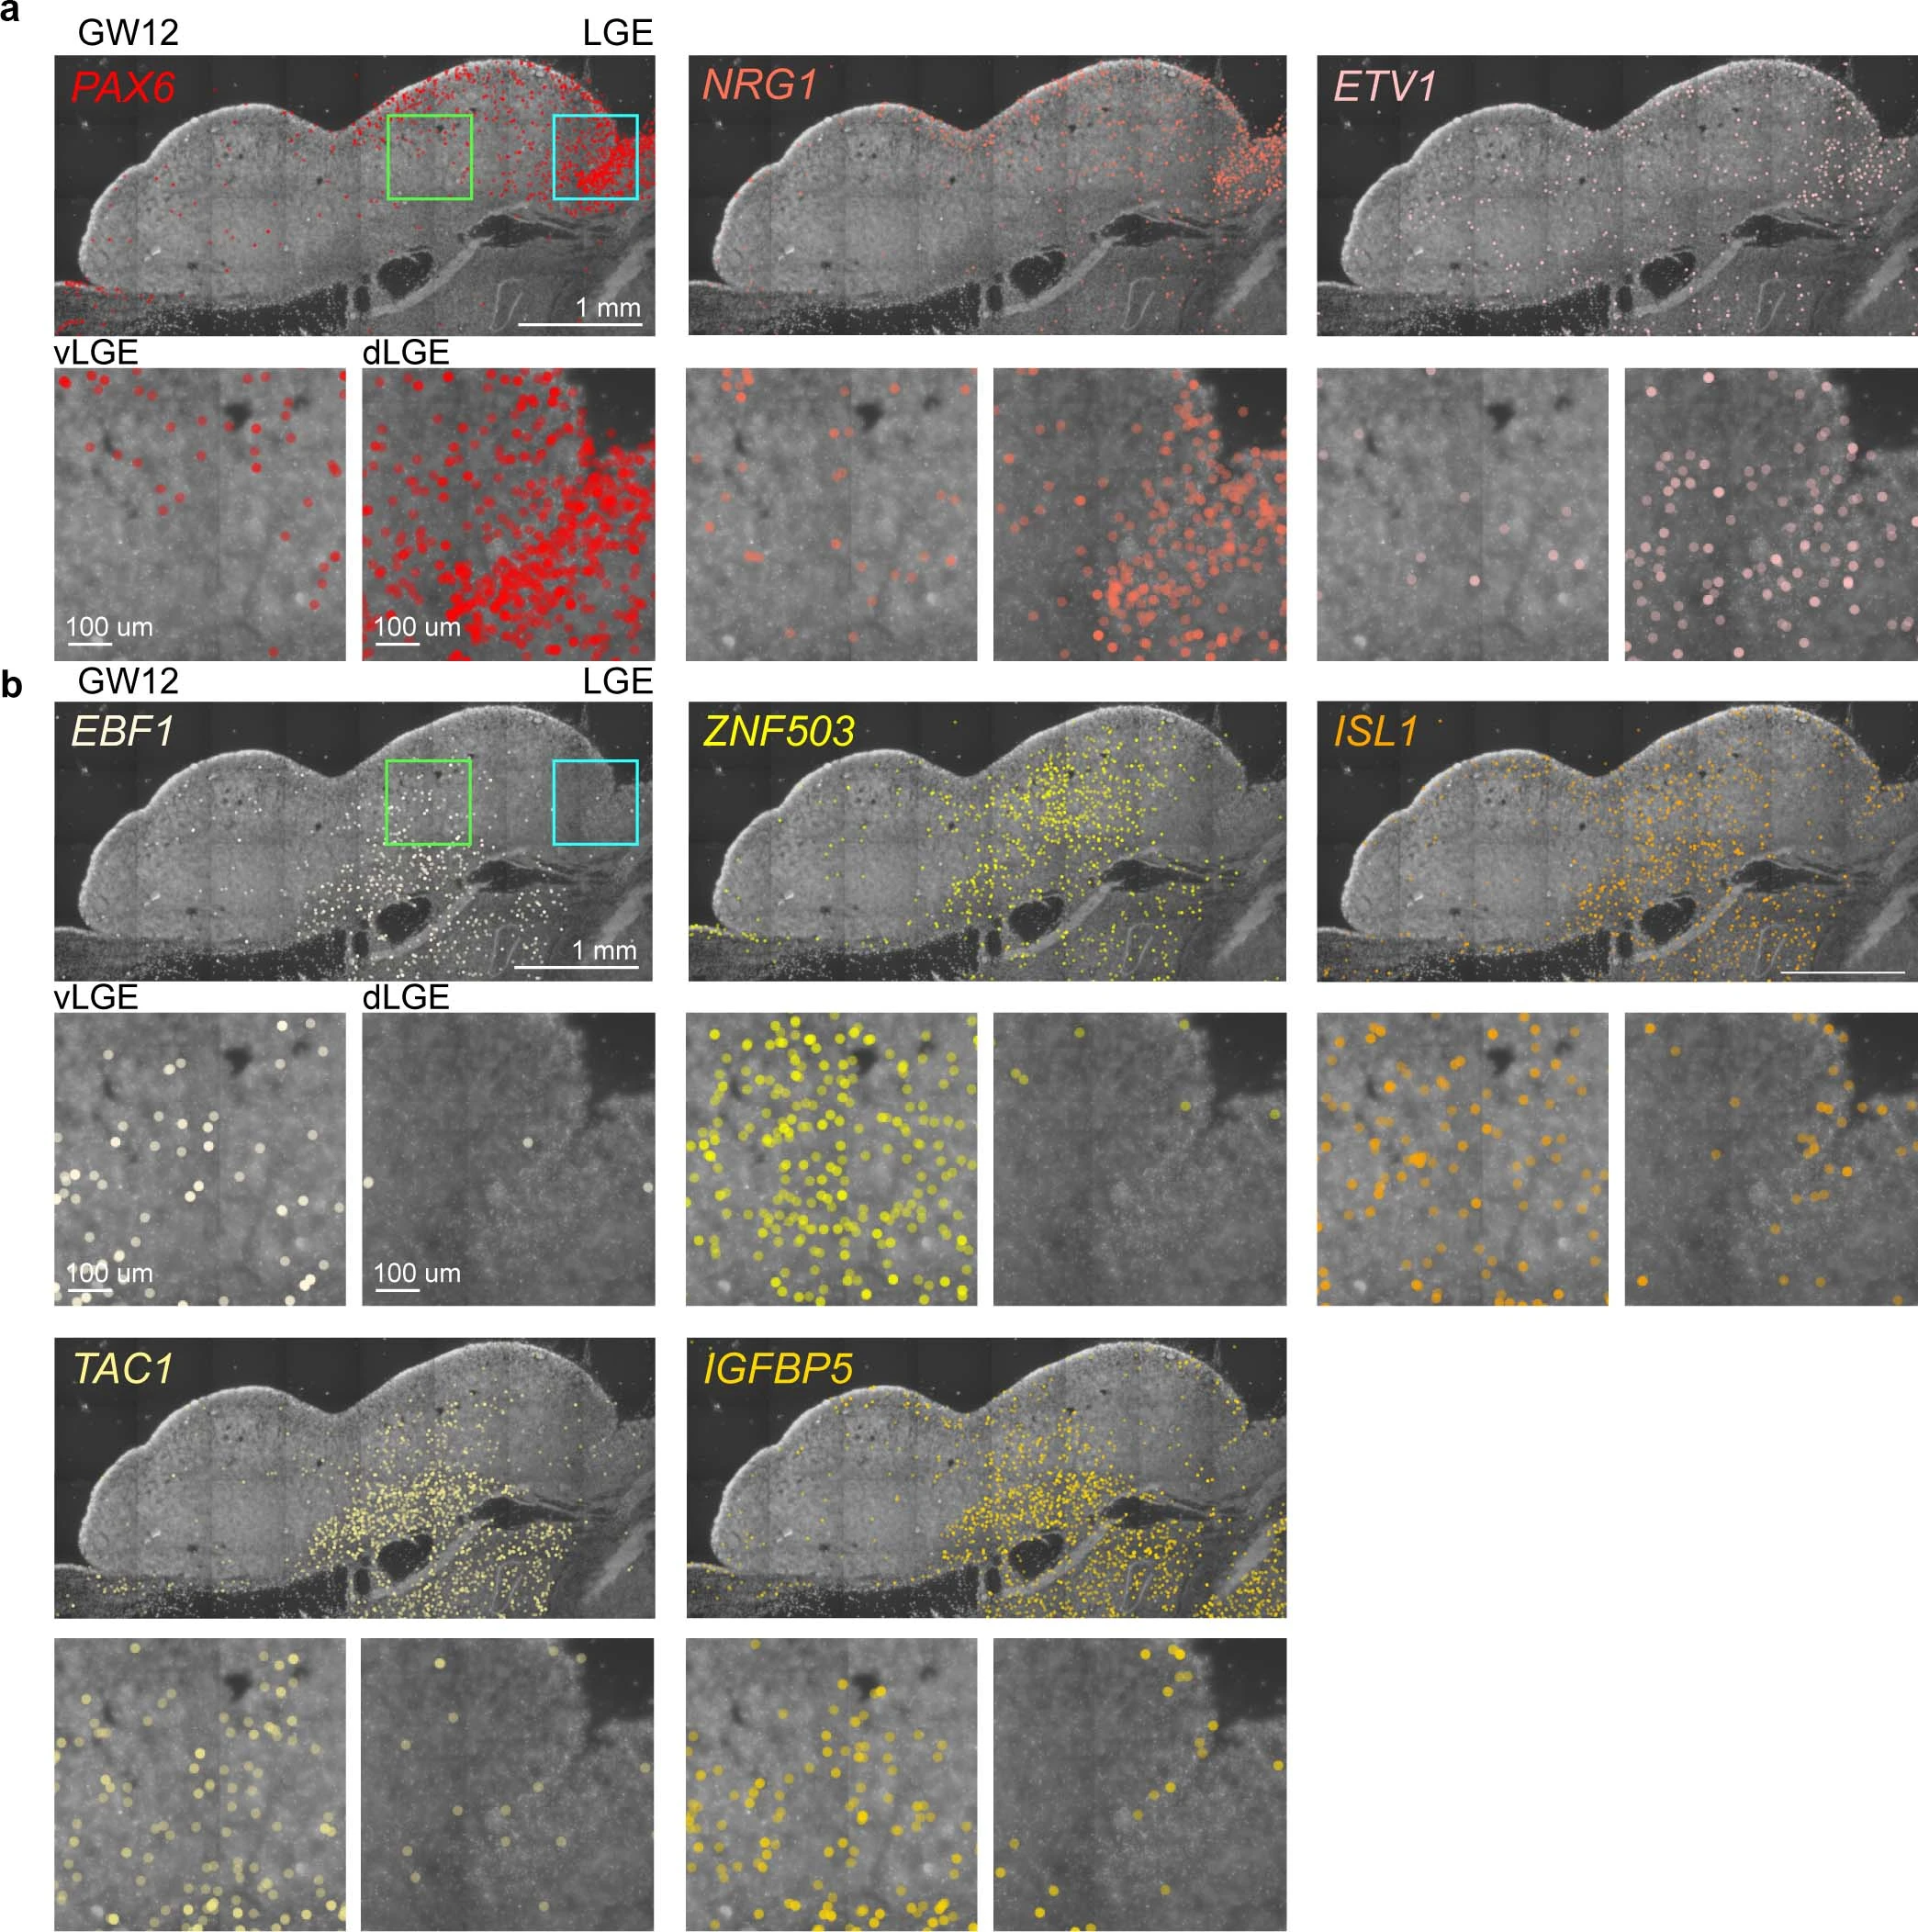
a and b, Expression patterns of 8 LGE specific genes in coronal sections of the human fetal brain at gestational week 12 (GW12) as detected by in situ sequencing (ISS). The ventral (green box) and dorsal (blue box) LGE are shown as vLGE and dLGE. The boxed areas also are shown in high power views. Scale bars: 1 mm and 100 µm.
Extended Data Fig. 10: Caudal ganglionic eminence (CGE)-derived interneuron precursors.

a, The transcription network regulated by CGE-specific transcription factors in interneuron precursors. b, Gene ontology (GO) enrichment analysis of target genes for CGE-specific transcription factors. c, A coronal section labeled with DAPI to illustrate cell nucleoli of one human fetal brain at gestational week 12 (GW12). d, Expression patterns of CALB2, NPAS3, ST18 and SP9 in the CGE in coronal sections of the human fetal brain at GW12, as detected by in situ sequencing (ISS). Scale bar: 1 mm.
ref.