

Abstract
In rodent models of type 2 diabetes (T2D), sustained remission of hyperglycemia can be induced by a single intracerebroventricular (icv) injection of fibroblast growth factor 1 (FGF1), and the mediobasal hypothalamus (MBH) was recently implicated as the brain area responsible for this effect.
To better understand the cellular response to FGF1 in the MBH, we sequenced >79,000 single-cell transcriptomes from the hypothalamus of diabetic Lepob/ob mice obtained on Days 1 and 5 after icv injection of either FGF1 or vehicle.
A wide range of transcriptional responses to FGF1 was observed across diverse hypothalamic cell types, with glial cell types responding much more robustly than neurons at both time points.
Tanycytes and ependymal cells were the most FGF1-responsive cell type at Day 1, but astrocytes and oligodendrocyte lineage cells subsequently became more responsive. Based on histochemical and ultrastructural evidence of enhanced cell-cell interactions between astrocytes and Agrp neurons (key components of the melanocortin system), we performed a series of studies showing that intact melanocortin signaling is required for the sustained antidiabetic action of FGF1.
These data collectively suggest that hypothalamic glial cells are leading targets for the effects of FGF1 and that sustained diabetes remission is dependent on intact melanocortin signaling.
Methods
Single-cell RNA-seq and single-nucleus RNA-seq data processing
Cell Ranger version 1.2 (10× Genomics, USA) was used to de-multiplex and quantify UMIs. A count matrix was generated for each sample with default parameters and genes were mapped to the mouse reference genome GRCm38 (mm10, part of the Cell Ranger software package; for the scRNA-seq dataset) or an adapted reference from mouse reference genome including introns (for the snRNA-seq dataset), following the steps outlined on the 10× Genomics website (https://support.10xgenomics.com/single-cell-gene-expression/software/pipelines/latest/advanced/references#premrna). Barcodes were filtered to include those with a total UMI count >10% of the 99th percentile of the expected recovered cells.
Quality control of single-cell and single-nucleus expression data
Scrublet was run with default parameters to identify likely doublets (this step was omitted for the snRNA-seq data), which were subsequently removed from the expression matrix. Further processing was performed using the Seurat R package (version 2.3).
Cells in which <400 or >4000 expressed genes were detected, as well as any cell with >20% (>5% for snRNA-seq) mitochondrial and/or ribosomal transcripts, were discarded. Genes detected in <10 cells (<5 cells in the snRNA-seq data) were also removed.
Counts were normalized using the SCtransform() from Seurat. Variable genes were identified using the function with default settings. Unwanted sources of variation, e.g., number of UMI and ribosomal and mitochondrial percentage, were regressed out using the ScaleData() function. PCs were found with variable genes using the RunPCA() function. The top 30 PCs were used to identify clusters and with the FindClusters() function at a resolution of 0.1.
Single-nucleus RNA-seq data clustering
UMAP projection of snRNA-seq data revealed a strong batch effect between samples in this dataset. To identify conserved populations between all samples, sample datasets were integrated using the Seurat commands FindIntegrationAnchors() and IntegrateData().
Following integration, the data were processed as described above. Following identification of marker genes with the FindMarkers() function, literature was searched for cell-specific genes to determine cluster identity. At this low-resolution clustering, we removed ambiguously mapping cells by identifying cells with low silhouette scores <0 and removed them from the dataset (https://perslab.github.io/bentsen-rausch-2020/). Finally, the data were re-clustered to identify major cell populations.
Single-cell RNA-seq data clustering and identification of cell types
The scRNA-seq data showed much reduced batch effect as compared to the snRNA-seq data, so the integration step was unnecessary.
Following identification of marker genes with the FindMarkers() function, literature was searched for cell-specific genes to determine cluster identity. All neuronal lineage cells were removed from this dataset, as the quality was poor due to mouse age (myelination/neuron fragility).
The final step was to further remove any artifacts/doublets, which had been missed in the initial round of processing. Each cell type underwent a round of iterative clustering as described above.
Within each cell type, any cluster in which 50% of cells originated from a single sample was removed. The FindMarkers() function was used to identify markers of each subcluster, which were removed if enriched for marker genes of a different cell type.
Finally, all remaining cells were merged to create the final dataset, and clustering was performed again with the same settings as above.
Label projection
To identify canonical hypothalamic neuron populations, we downloaded three existing single-cell studies characterizing cell types in the MBH region.
The raw data were processed with Seurat using default parameters and original labels were maintained. The projection was performed iteratively in that we first took the Campbell et al. data (GSE93374) and used the FindTransferAnchors() and TransferData() commands (default settings, 30 dimensions) to transfer labels to the query data. All cells that were assigned a label with >75% confidence were removed from the query dataset.
We then performed label projection using the Chen et al. (GSE87544) and the Romanov et al. (GSE74672) datasets as described above.
All mapped cells were then extracted and reclustered as described above. Clusters were annotated based on marker genes and the projected label that appeared most times in the identified cluster.
Differential gene expression resampling
A strong driver of differential expression in single-cell data is the cell number. To control for this, our resampling procedure randomly selects ten cells per cluster per sample for pseudobulk analysis (see below). The test was performed 100 times per cluster to generate a distribution of DEGs. Bonferroni adjustment was used to account for multiple testing.
Pseudobulk analysis
Pre-determined clusters were split by sample. Raw counts were summed across each gene per sample to generate a single column per sample. This matrix was then fed directly into DESeq2 tool (version 1.22.2) for standard processing.
Pathway enrichment analysis for pseudobulk results
DEGs were tested for functional enrichment of GO (GO:BP category), REACTOME, and KEGG pathways using the gProfiler R package.
gProfiler parameters were adjusted to indicate the use of an ordered query, limit testing to pathways containing between 10 and 300 genes, a minimum intersection size of 3 genes, and a strong hierarchical filtering of GO terms.
A custom background was set for all analyses to include all genes that were used for DESeq2 analyses. A z-score was calculated for each term by calculating the number of upregulated minus downregulated genes divided by the square root of the number of genes that overlapped within a term.
WGCNA and adjacency matrix calculation
The WGCNA package (version 1.66) implemented in R was used. Pearson correlation coefficient was used for the single-cell data and signed network parameter was used to compute the gene–gene adjacency matrix.
Powers corresponding to the top 95th percentile of network connectivity or above were discarded and the lowest soft threshold power between 1 and 30 to achieve a scale-free topology R-squared fit of 0.8 was selected.
WGCNA hierarchical clustering
The topological overlap matrices were converted to distance matrices, and the hclust() function was used with the average (clusters <3000 cells) or complete (clusters >3000 cells) method to cluster genes hierarchically.
The cutreeDynamic() function was used with a deepSplit parameter of 2 (clusters >3000 cells) or 4 (clusters <3000 cells) and the pamStage parameter set to FALSE to carve the dendrogram into modules with at least 15 genes.
The mergeCloseModules() function was used to compute module eigengenes, the vector of cell embeddings on the first PC of each module’s expression submatrix.
The same function was used to merge modules, using a cutHeight of ≤0.2, corresponding to a Pearson correlation between module eigengenes of ≥0.8. The module eigengenes and expression matrices were used with the signedKME() function to compute gene–module Pearson correlations, or kMEs, a measure of how close each gene is to each module. Module treatment associations were tested using a linear mixed-effects model with the nlme R package(function lme()), using a random effect for each sample. Treatment and batch were modeled as fixed effects to control for variation between samples. Significance values are FDR corrected to account for multiple testing.
Geneset enrichment analysis
Genes within each module were ordered based on their module membership (kME) and tested for functional enrichment of GO:BP terms, REACTOME, and KEGG pathways using the gProfiler R package. gProfiler parameters were adjusted to indicate the use of an ordered query, limit testing to pathways containing between 10 and 300 genes, a minimum intersection size of 3 genes, and a strong hierarchical filtering of GO terms. A custom background was set for all single-cell analyses to include only the 5000 most variable genes, which were used for WGCNA-based analyses.
Tanycyte analysis
Labels were propagated from the Campbell et al. dataset(GSE93374) using the Seurat (version 3.0) SCTintegration() pipeline with default settings and 30 dimensions. All cells that were assigned a label with >50% confidence were further analyzed.
PCA was performed on all tanycytes using the RunPCA() function in Seurat. Upon identification of a gene expression continuum in PC1/PC2, the princurve R package was used with default settings to fit a principal curve to the data.
Each cell was assigned a lambda value along the principal curve to be used as a measure of pseudoventricle height. To calculate the effect of FGF1 on module expression over pseudoventricle height, module expression was binned with a width of 1. Average expression and SEM was calculated at each pseudoventricle value.
Linear regression was performed to identify significant changes in expression.
Astrocyte analysis
To better characterize genesets induced in astrocytes by FGF1, hypergeometric enrichment was performed to test whether the genesets enriched for markers of astrocytes in middle cerebral artery occlusion (MCAO)/lipopolysaccharide (LPS) mice or astrocytes co-cultured with neurons.
Prior to the analysis, the Zamanian et al (GSE35338) and Hasel et al. (E-MTAB-5514) datasets were downloaded and DEG analysis was performed.
Genesets were constructed by identifying any gene with a log2 FC > 2 and FDR < 0.05 (omitted for the Zamanian et al. dataset) in any of the conditions described. Any genes shared between LPS and MCAO at Day 1 were assigned to the PAN-reactive geneset. Furthermore, any gene found to overlap between LPS and MCAO was removed from the geneset. All p values were FDR corrected.
Oligodendrocyte analysis
Labels were propagated from Marques et al (GSE75330) using the Seurat pipeline with default settings and 30 dimensions. All cells which were assigned a label with >50% confidence were further analyzed.
Shifts in cell type abundance across conditions were tested using the Student’s t test. To further analyze the effects of FGF1 on oligodendrocytes, a pseudo-developmental timeline of oligodendrocyte differentiation was built with Monocle2. Cells were ordered based on genes that differ between clusters, a procedure referred to as dpFeature.
tSNE dimensional reduction was performed using two PCs. Cells were then clustered in this with the clusterCells() command with a local density (p value) value of 150 and a nearest distance of a cell (delta) value of 15. DEGs between clusters were identified with the differentialGeneTest() command. The top 1000 DEGs were extracted for cell ordering. The pseudotime axis of differentiation was determined based on the expression of previously established markers.
Figure
Fig. 1: Study design and icv FGF1-induced temporal glia responses.
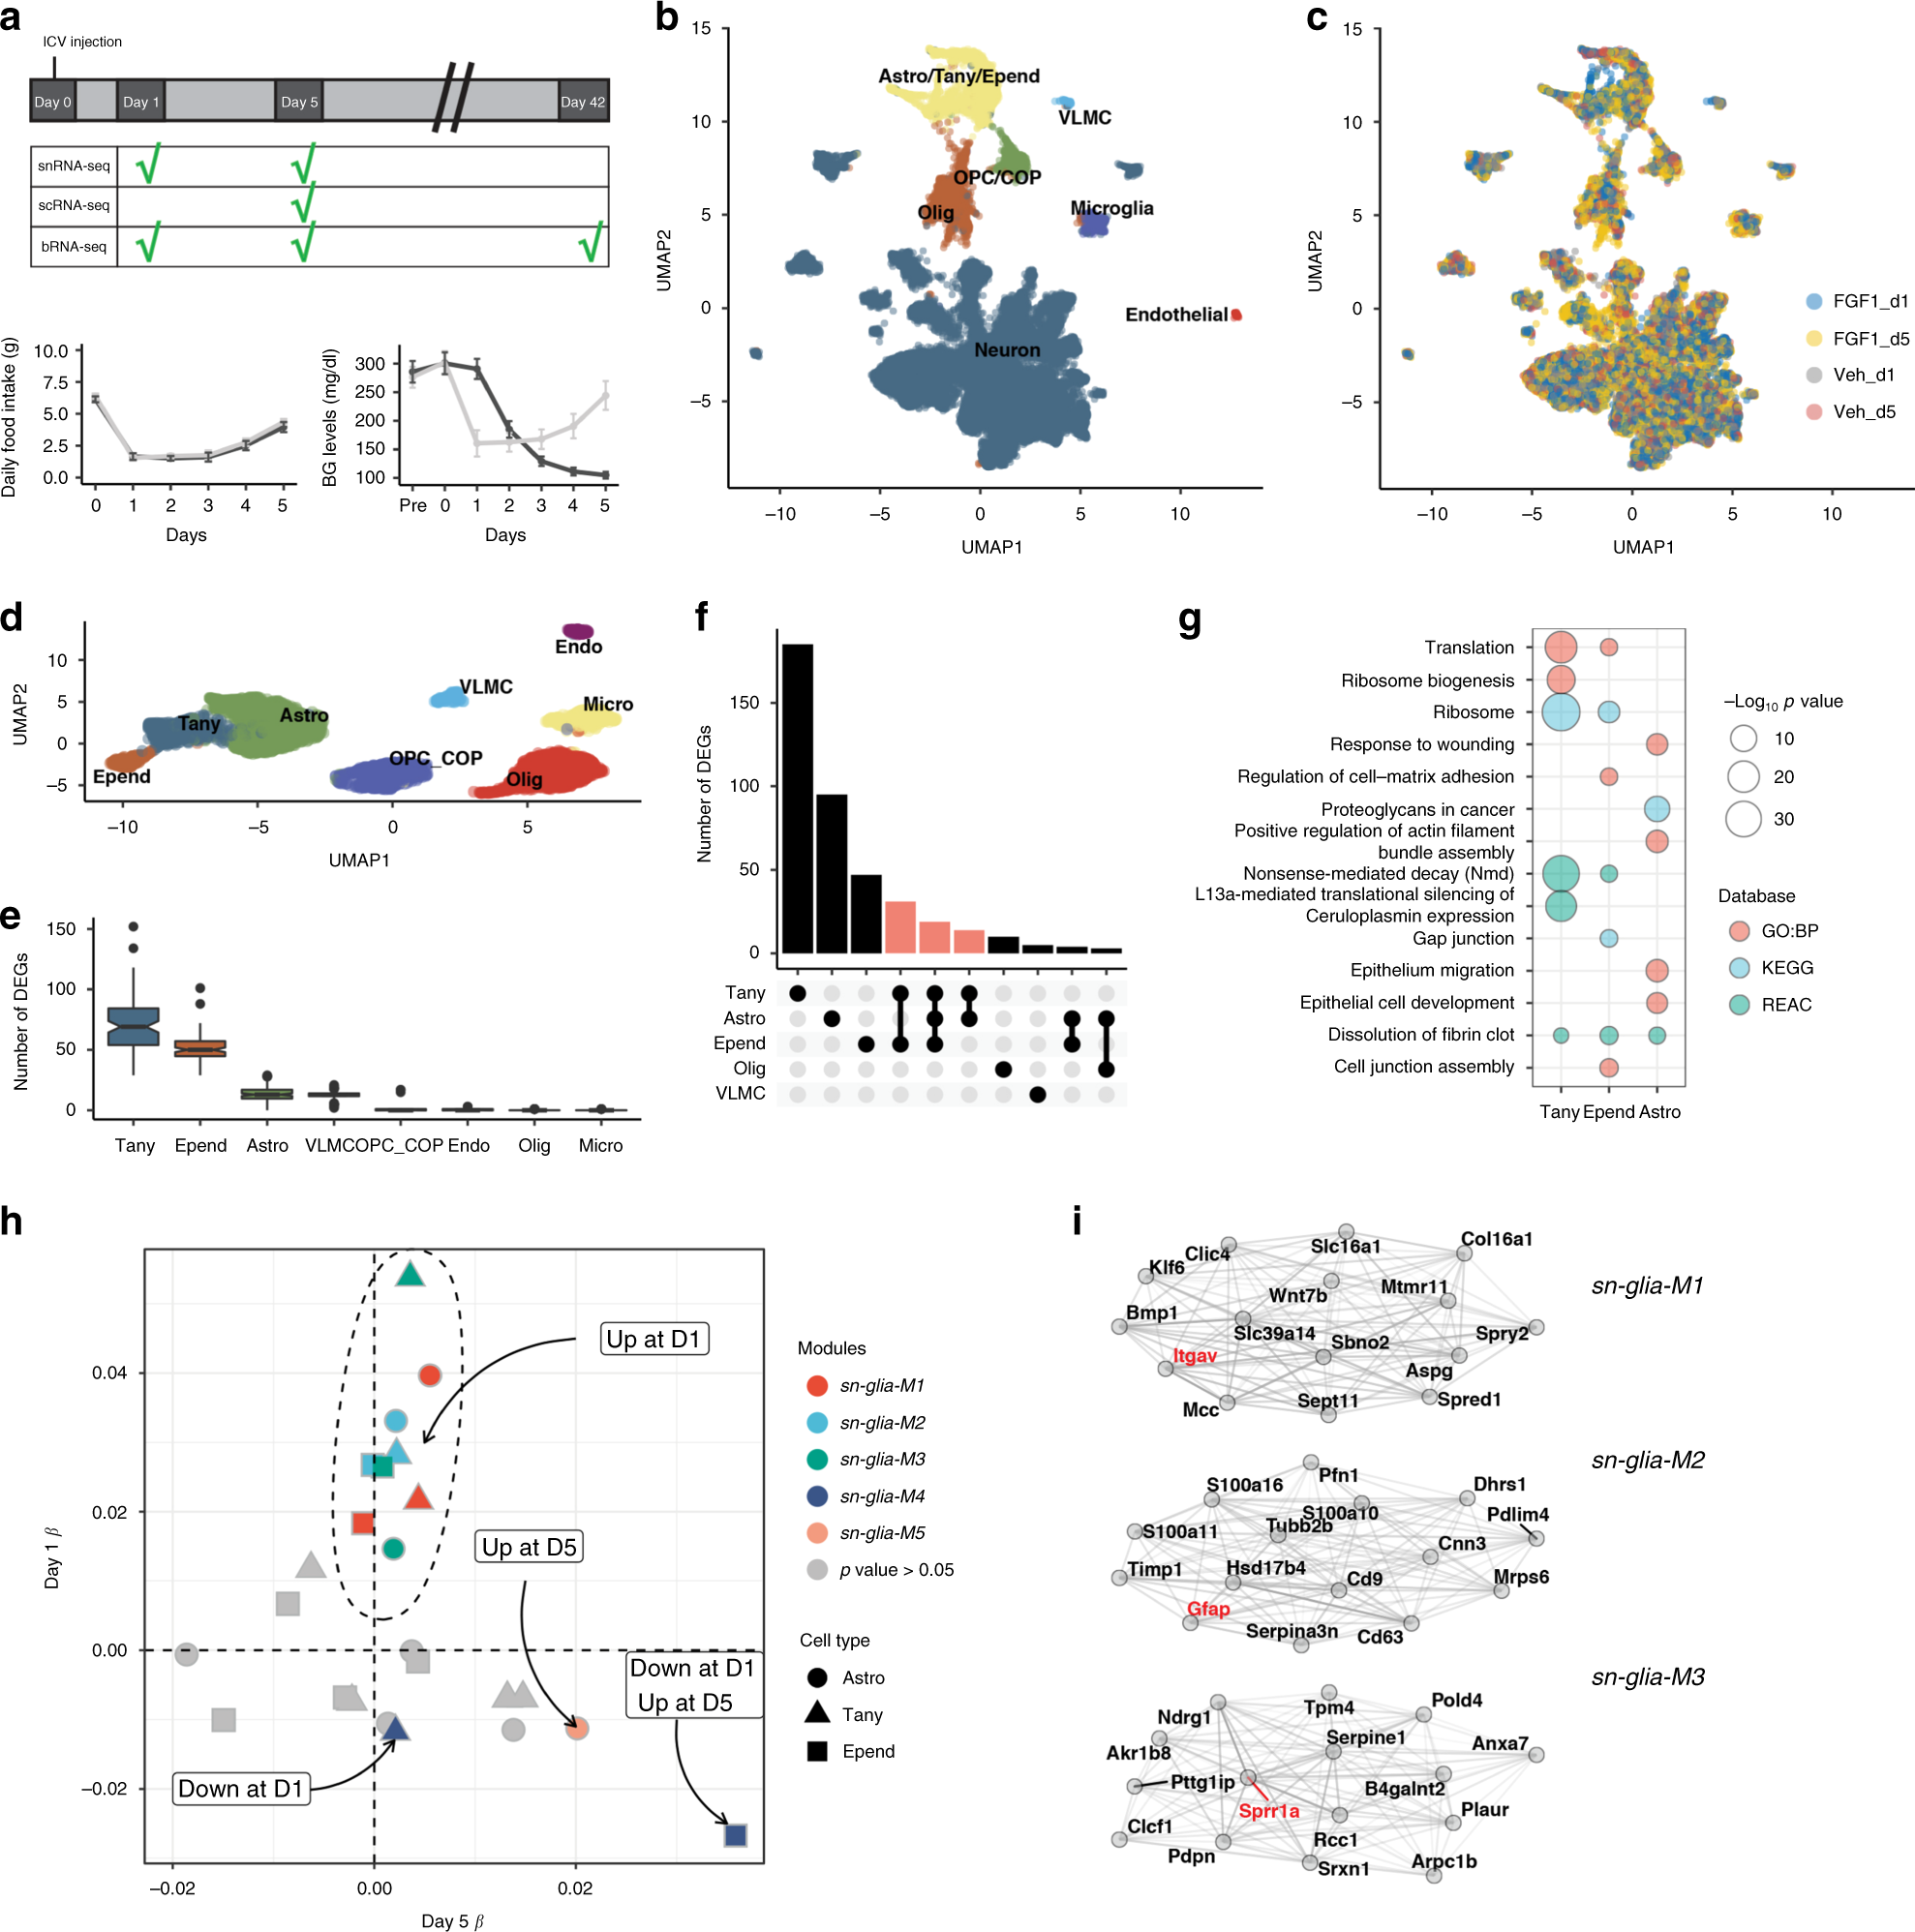
a Diabetic Lepob/ob mice received a single intracerebroventricular (icv) injection of FGF1 (3 µg) or vehicle at Day 0. Hypothalami were harvested on Days 1, 5, and 42 after icv injection. Vehicle-injected mice were pair-fed (PF) to the amount of food consumed by icv FGF1-injected Lepob/ob mice and morning blood glucose levels were monitored. Plots are represented as mean ± SEM, and source data are provided as a Source data file; FGF1 (n = 17), vehicle (n = 15). b Uniform manifold approximation and projection (UMAP) clustering of hypothalamic nuclei from Day 1 and Day 5 snRNA-seq datasets. Source data are available through the NCBI Gene Expression Omnibus (GEO; GSE153551). c UMAP clustering from b colored according to treatment group and time of euthanasia. d UMAP clustering of hypothalamic non-neuronal cells from Day 1 and Day 5 snRNA-seq datasets. e Number of differentially expressed genes (DEGs) for non-neuronal subclusters at Day 1 identified through repeated downsampling (10 cells/group/cell type/iteration; 100 iterations), n = 3 mice/group. Data are presented as median with interquartile range (IQR) and summary statistics are provided as a Source data file. f Each bar represents the number of unique DEGs for one or a certain combination of cell types (pseudobulk approach, see “Methods”) from Day 1 snRNA-seq dataset, n = 3 mice/group. g Associated Gene Ontology terms (biological process category; red), KEGG (blue) and REACTOME (green) pathways associated with DEGs in the indicated cell types. Point size indicates −log10(p value) (Bonferroni adjusted). h Weighted gene co-expression network analysis (WGCNA) of tanycytes, ependymal cells, and astrocytes from Days 1 and 5 snRNA-seq datasets. Significantly changed gene modules (linear mixed-effects model; FDR < 0.05) are indicated with color and cell-specific expression is indicated by shape. Modules are plotted according to their β-values; Day 1 (n = 3/group), Day 5 (n = 2/group). i Module plots of top 15 genes of sn-glia-M1–sn-glia-M3, which are upregulated on Day 1. Genes in red denote genes mentioned in the text. Astro astrocytes, Tany tanycytes, Epend ependymal cells, Olig oligodendrocytes, OPC oligodendrocyte precursor cell, COP committed to differentiate oligodendrocyte, VLMC vascular leptomeningeal cell.
Fig. 2: Tanycyte module expression maps to the spatial distribution lining the third ventricle.

a UMAP clustering of tanycytes (β2-, β1-, α1-, α2-Tanycytes) from the Day 5 single-cell RNA-sequencing (scRNA-seq) dataset. Cell type annotations were inferred from a published dataset16. b Tanycyte lineage cells plotted on principal components 1 and 2 revealed a trajectory (left). The colors represent the subtype of each cell from a. A principal curve fit across the trajectory was used to assign a pseudoventricle score to each cell corresponding to the spatial location of that cell type along third ventricular (3V) wall. Density plot of each tanycyte subpopulation plotted along the pseudoventricle revealed a continuum of gene expression and non-distinct shifts in the expression of marker genes along the pseudoventricle. c Scaled module expression of sc-tany-M1 in FGF1-treated (black) and vehicle (gray) tanycytes (linear mixed-effects model; bin size of 1; mean ± SEM; p < 0.05) (Bonferroni adjusted) from the Day 5 scRNA-seq dataset (n = 6 mice/group). Exact adjusted p* values are provided in Supplementary Data 5. ME module eigengene. d Gene–gene network plot of the correlation of top 15 genes in module sc-tany-M1 (left) and associated pathways (right). Genes mentioned in the text are labeled in red. e Representative images of immunolabeling of vimentin in diabetic Lepob/ob mice 1 week after vehicle or icv FGF1 injection. Pixel dimensions: 0.27 × 0.27 × 2.00 microns. Quantification: dots represent volume of vimentin-positive voxels assessed by iMARIS for individual animals (mean from 2 sections per animal, n = 4/group), mean ± SEM. Unpaired t test, two tailed, p = 0.022 (not adjusted). Source data are provided as a Source data file. f Scaled module expression of sc-tany-M2, sc-tany-M3, sc-tany-M5, sc-tany-M6, and sc-tany-M23 with 5 consecutive points of difference in expression along the pseudoventricle between FGF1-treated (black) and vehicle (gray) tanycytes (linear mixed-effects models; bin size of 1; mean ± SEM; **p < 0.05) (Bonferroni adjusted) from the Day 5 scRNA-seq dataset (n = 6 mice/group). Exact adjusted p values are provided in Supplementary Data 5.
Fig. 3: Evolution of the astrocyte response to icv FGF1.

a Identification of sn-astro-M1–sn-astro-M3 upregulated at Day 1 and sn-astro-M4 upregulated at Day 5 in FGF1-treated mice (linear mixed-effects model, FDR < 0.05) using WGCNA on astrocytes from the snRNA-seq datasets. Enrichment of DEGs in astrocytes in response to lipopolysaccharide (neurotoxic, A1), middle cerebral artery occlusion (neuroprotective, A2), or overlapping genes (PAN)25 or enrichment of genes induced by neuron interaction (NeurI) or neuron activity (NeurA)31. Point size is scaled by −log10(p value) (Bonferroni adjusted). b Correlation of top 15 genes of sn-astro-M1–sn-astro-M4. Node size; correlation of the given gene with the module eigengene (kME). c Number of DEGs for non-neuronal subclusters identified in the Day 5 scRNA-seq dataset with repeated downsampling (10 cells/group/cell type/iteration, 100 iterations; n = 6 mice/group), median (IQR). Summary statistics provided as a Source data file. Macro macrophages, Peri pericytes, ABC arachnoid barrier cells, SMC smooth muscle cells, VLMC vascular leptomeningeal cells. d Volcano plot of pseudobulk DEGs in astrocytes Day 5, scRNA-seq dataset between FGF1 and vehicle. Blue, genes with FDR < 0.05; red, genes with FDR < 0.05 and |log2 fold change| > 0.25; green, genes with |log2 fold change| > 0.25; gray, genes below both thresholds. e Astrocytes WGCNA (Day 5; scRNA-seq) identified three significant upregulated (sc-astro-M1–sc-astro-M3; linear mixed-effects model; FDR < 0.05) and three downregulated (sc-astro-M5, sc-astro-M6, sc-astro-M9) modules in FGF1-treated mice, median (IQR). Lower panel: hypergeometric enrichment analysis of single-nucleus RNA-sequencing (snRNA-seq) and scRNA-seq astrocyte modules. Point size is scaled by −log10(p value) (Bonferroni adjusted; n = 6 mice/group). f Correlation of top 15 genes in modules sc-astro-M1 and sc-astro-M3. g Representative images of immunoreactivity of aquaporin 4 (Aqp4; red) and glial fibrillary acid protein (GFAP; green) from coronal sections of hypothalamus from diabetic Lepob/ob mice 1 week after either vehicle or FGF1 icv injection. Lower panels: higher magnification of white inset. Scale bar 100 μm (top), 50 μm (lower). Pixel dimensions: 0.27 × 0.27 × 2.00 microns. Quantification: dots represent volume of Aqp4- or GFAP-positive voxels for individual animals (mean from 2 sections per animal, n = 4/group), mean ± SEM. Unpaired t test, two tailed, p = 0.037, p* = 0.003 (not adjusted). Source data are provided as a Source data file. Genes mentioned in the text are labeled in red.
Fig. 4: Icv FGF1 induces a population of differentiating oligodendrocytes.
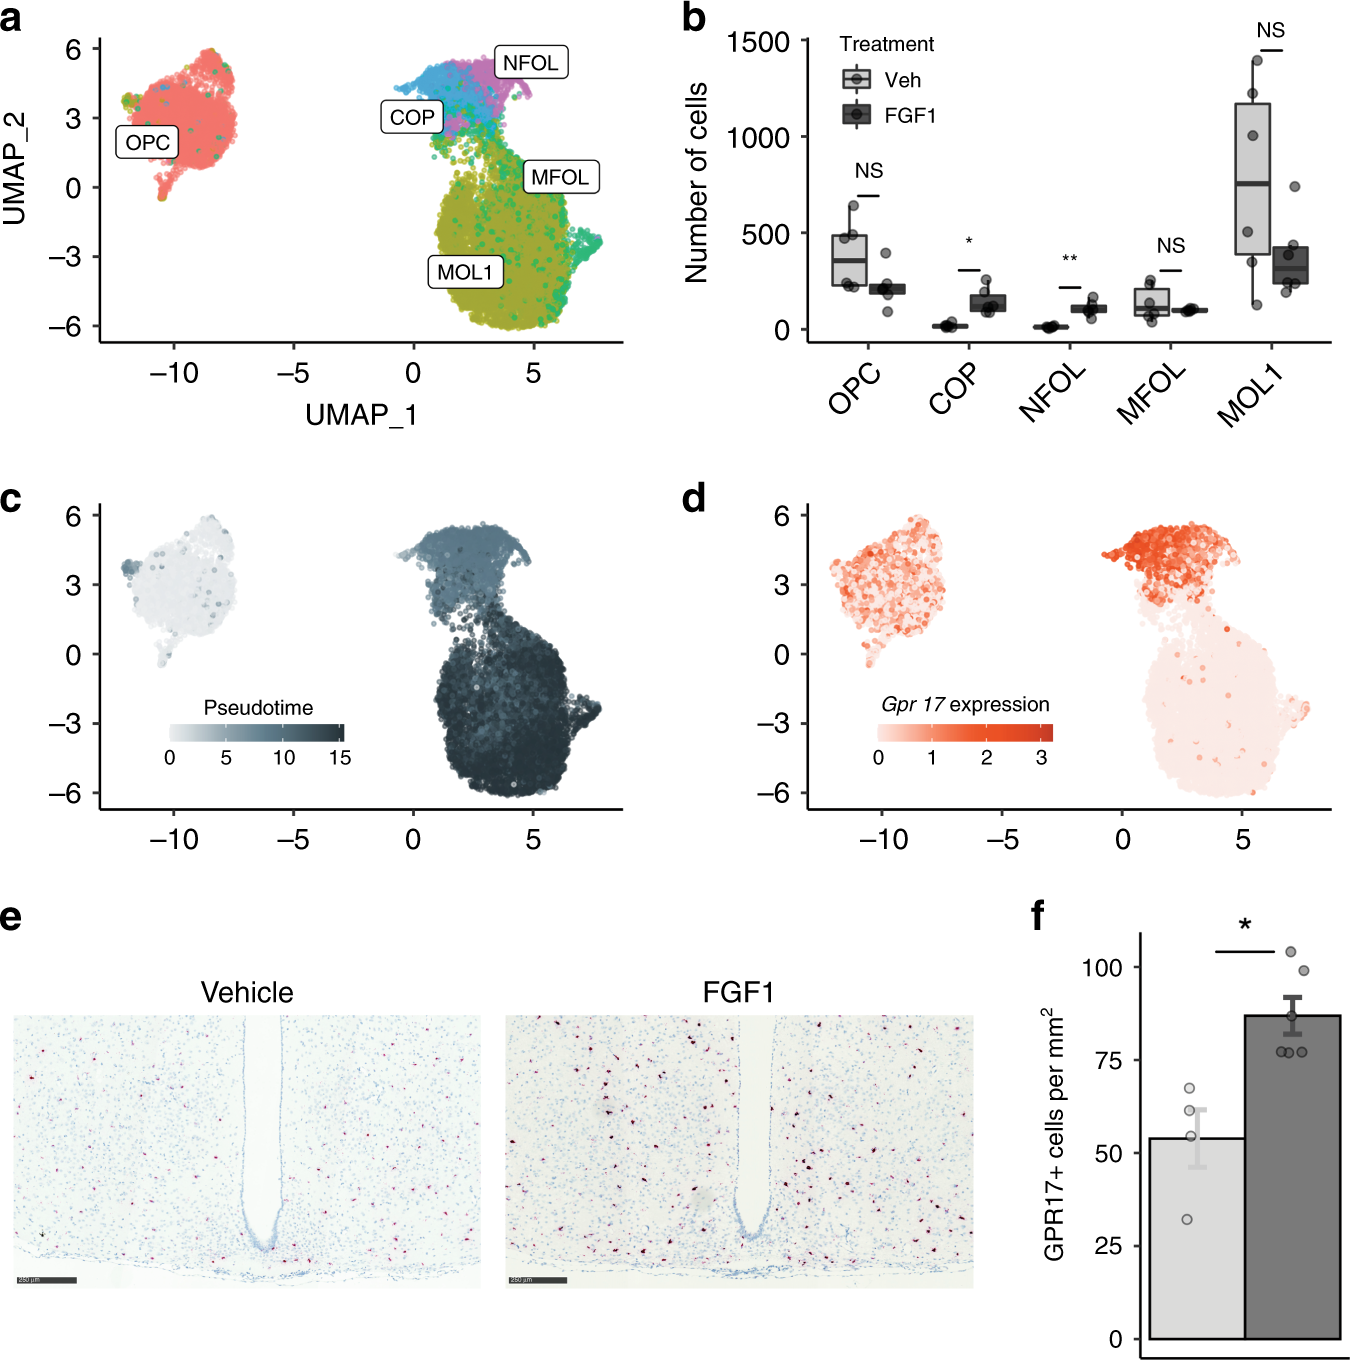
a UMAP clustering of cells in the oligodendrocyte lineage from the Day 5 scRNA-seq dataset. Cell type annotations were inferred from a published dataset35. b Dots represent mean number of cells per animal and lines represent mean ± SEM. Unpaired t test, two tailed, p < 0.022, p < 0.0074 (Bonferroni adjusted; n = 6 mice/group); ns not significant. Source data for each subcluster are provided as a Source data file. c UMAP of cells in the oligodendrocyte lineage labeled according to maturation in Monocle-derived pseudotime. d UMAP of cells expressing Gpr17, a maturing oligodendrocyte marker. e RNAScope detection of Gpr17 expression in the hypothalamus of Lepob/ob mice 5 days after icv FGF1 or vehicle. f Quantification of Gpr17+ cells from the ARC area (2 sections per animal, icv vehicle (n = 4) and icv FGF1 (n = 5)), mean ± SEM. Unpaired t test, two tailed, **p = 0.005 (not adjusted). Source data are provided as a Source data file. NFOL newly formed oligodendrocyte, MFOL myelin-forming oligodendrocyte, MOL1 myelinating oligodendrocyte.
Fig. 5: Effects of icv FGF1 on Agrp neurons.
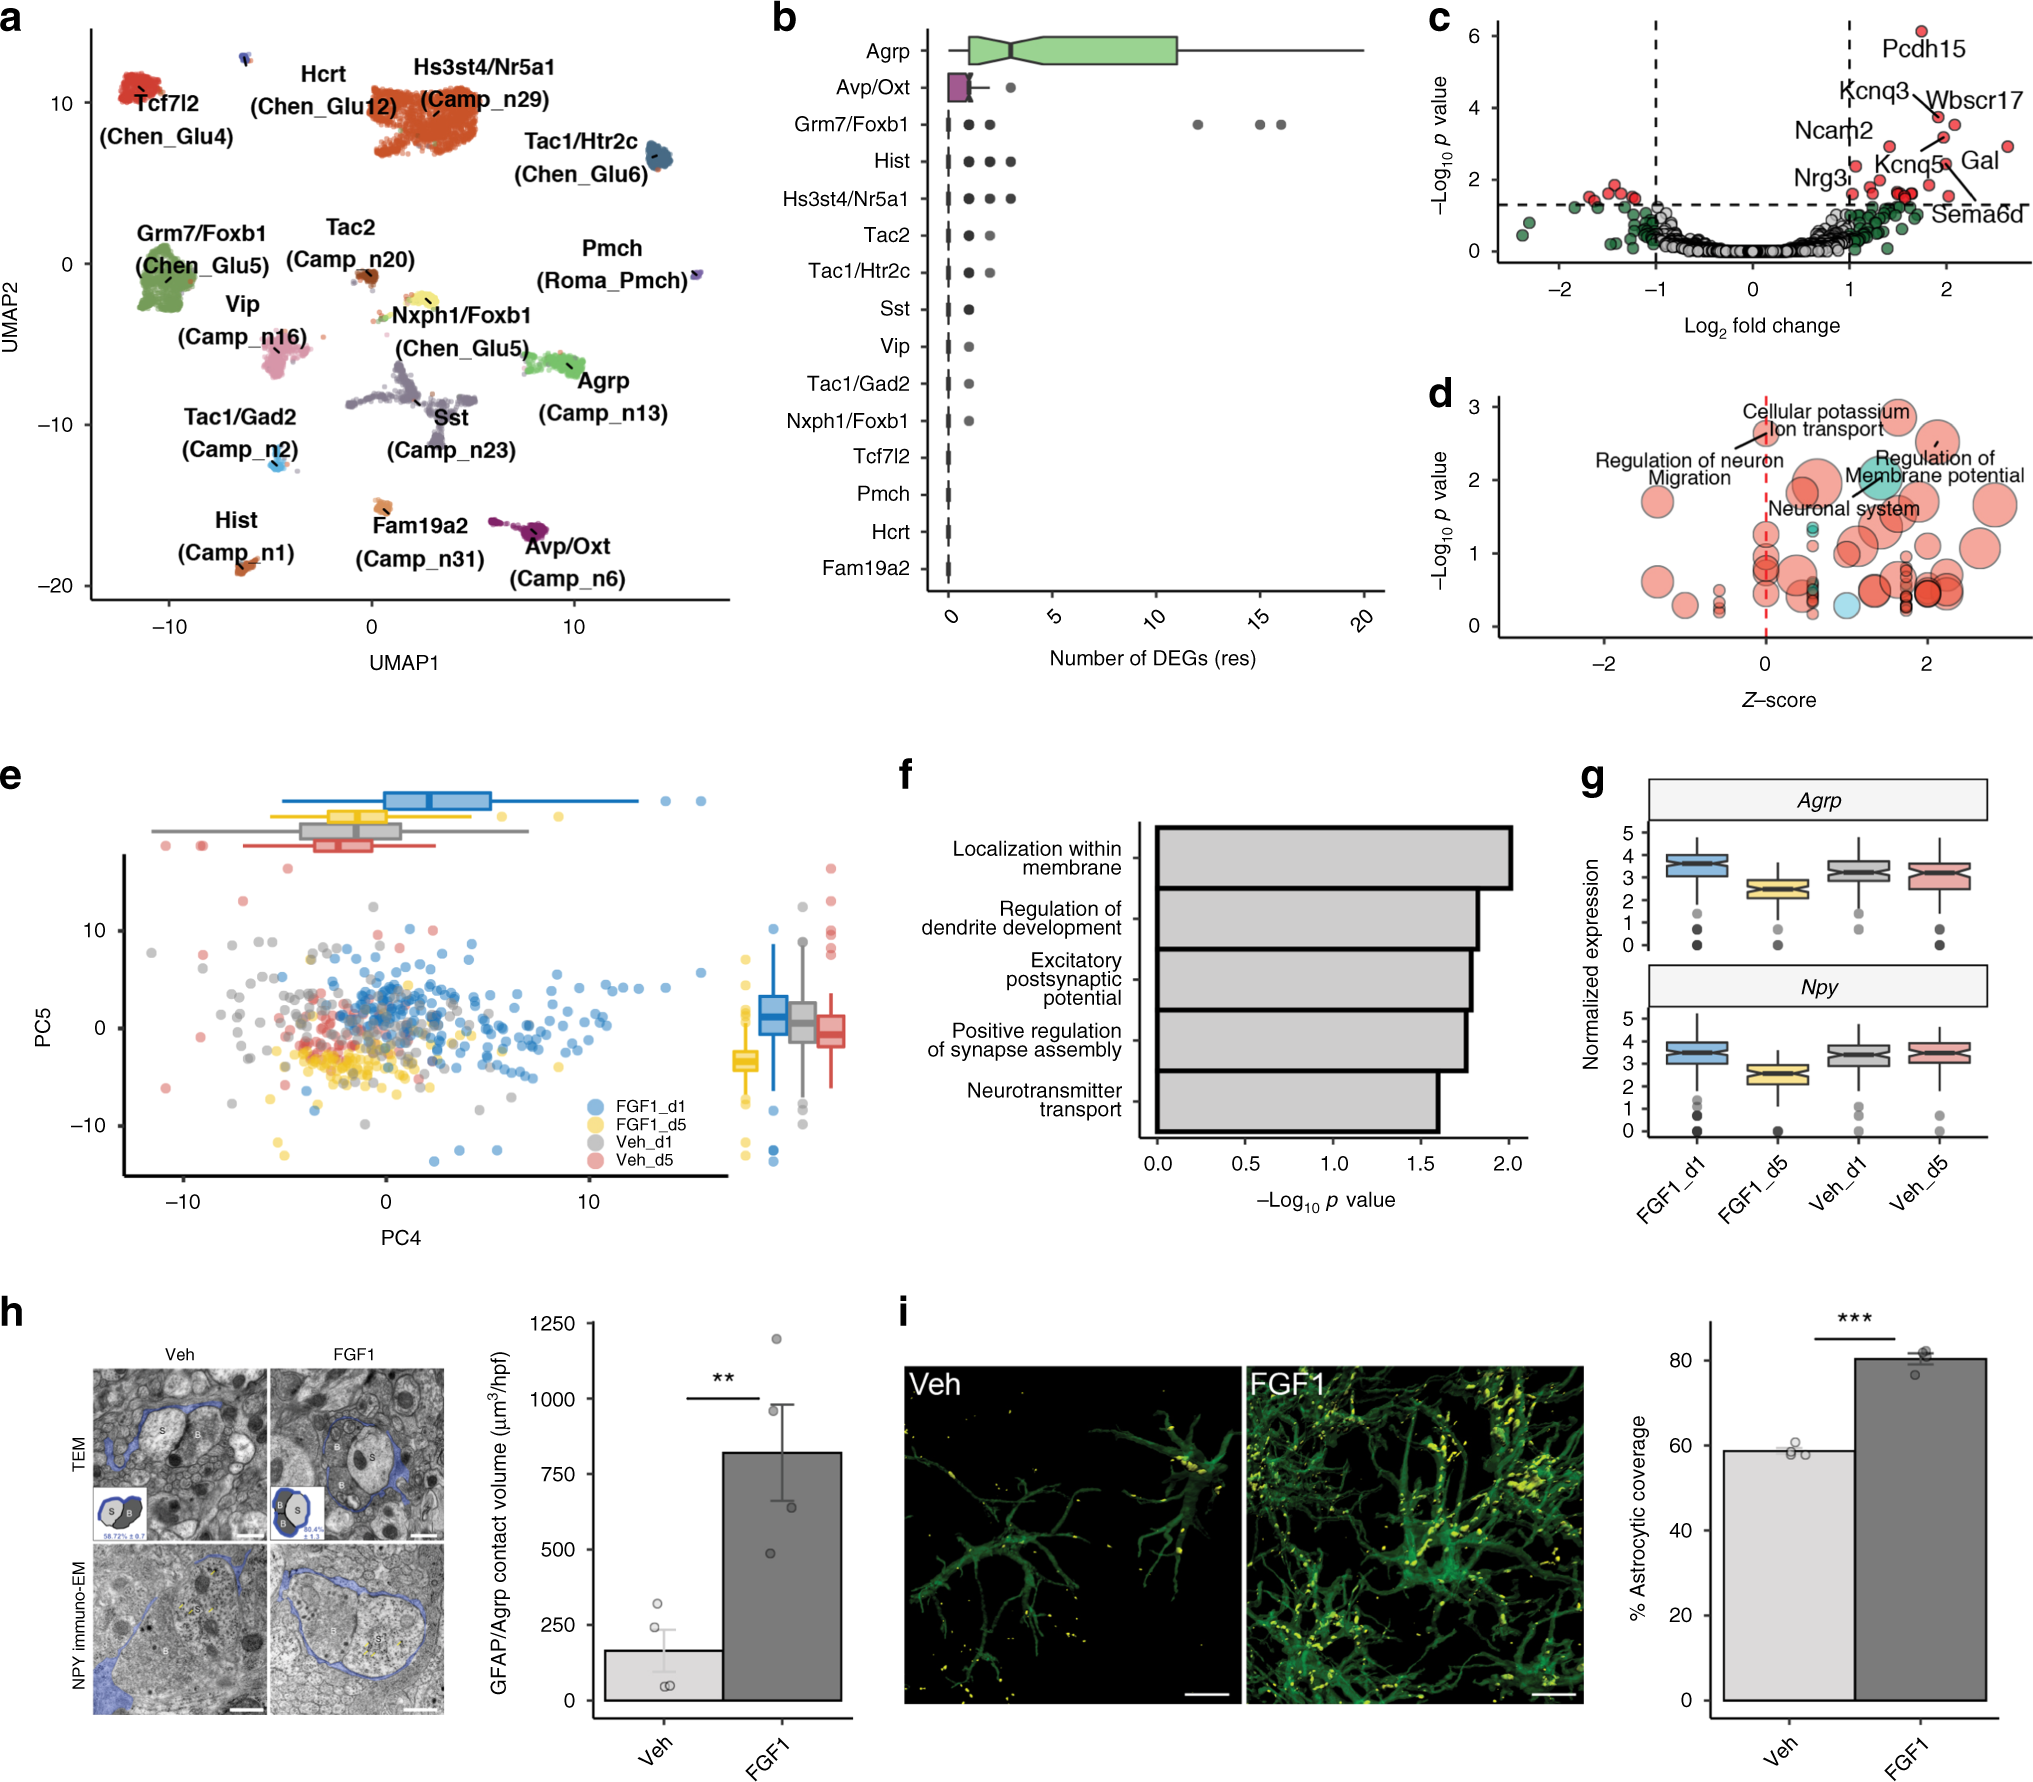
a UMAP clustering of neurons from the snRNA-seq dataset that confidently mapped to published datasets16,17,18. Original cell type annotations from the published datasets are indicated in brackets. b Numbers of DEGs for neuron subclusters identified using repeated downsampling (10 cells/group/cell type/iteration, 100 iterations; n = 3 mice/group), median (IQR). c Volcano plot of pseudobulk DEGs in Agrp neurons from the Day 1 snRNA-seq dataset between FGF1 and vehicle. Red, genes with FDR < 0.05 and |log2 fold change| > 0.25; green, genes with an |log2 fold change| > 0.25; gray, genes below both thresholds. d Gene Ontology (biological process; red) and REACTOME (blue) terms enriched for DEGs in Agrp neurons at Day 1. Circle size denotes gene overlap with the identified geneset. e Principal component analysis of Agrp neurons sampled at Days 1 and 5 (vehicle and FGF1) revealed strong separation from other groups at PC4 and PC5, respectively (n = 3 mice/group Day 1, n = 2 mice/group Day 5), median (IQR). f Gene Ontology term (biological processes) of highly loading genes on PC5. g Normalized expression of Agrp and Npy in Agrp neurons across the 4 groups (FGF1, Days 1 and 5; vehicle, Days 1 and 5; n = 3 mice/group Day 1, n = 2 mice/group Day 5). h Top panel: representative electron microscopic images of coverage of synapses between axonal boutons (B) and dendritic spines (S) by peri-synaptic astrocytic in the ARC area of Lepob/ob mice. Bottom panel: immunostaining for Npy. Scale bar 500 nm. Quantification: dots represent percentage of astrocytic coverage for individual animals (mean of 30 synapses per animal, n = 4/group), mean ± SEM. Unpaired t test, two tailed, *p < 0.0001 (not adjusted). i Contacts between GFAP(+) astrocytes (green) and Agrp(+) neurons in the ARC area (equivalent to outline in g) 1 week following icv FGF1 or vehicle injection of Lepob/ob. Yellow represents co-labeled GFAP-positive and Agrp-positive voxels. Scale bar 8 μm. Pixel dimensions: 0.057 × 0.057 × 0.500 microns. Quantification: dots represent mean contact volume over high power field (hpf: 116.5 × 116.5 microns) for individual animals (2 sections per animal, n = 4/group), mean ± SEM. Unpaired t test, two tailed, *p* = 0.0093 (not adjusted). Source data and summary statistics are provided as a Source data file.
Fig. 6: FGF1-induced sustained diabetes remission is melanocortin dependent.

a Blood glucose levels and food intake in diabetic Mc4r−/− (Mc4r knockout) mice injected with icv FGF1 (3 µg) or vehicle (n = 8/group). b Blood glucose levels and food intake in agouti (KK-Ay) mice icv injected with FGF1 (3 µg) (n = 12) or vehicle (n = 9). Vehicle-injected mice were not pair-fed to the intake of mice receiving FGF1. c Blood glucose levels and food intake of diabetic Lepob/ob mice treated with either a single icv injection of FGF1 (3 µg) or vehicle, followed immediately by continuous icv infusion of either vehicle or the Mc4r antagonist SHU9119 (5 nmol/day) for 28 days. Veh+Veh (n = 8), FGF1+Veh (n = 9), Veh+SHU (n = 6), FGF1+SHU (n = 8). Data are represented as mean ± SEM, source data are provided as a Source data file.
Fig. 7: FGF1-induced long-term changes in the hypothalamus.

a Number of DEGs (|log2 fold change| > 0.5; FDR < 0.05) from bulk RNA-sequencing (bRNA-seq) of hypothalami from Lepob/ob mice injected with icv FGF1 or vehicle and harvested Days 1 (FGF1 n = 10, vehicle n = 4), 5 (FGF1 n = 9, vehicle n = 7), and 42 (n = 5 mice/group) after injection. Control vehicle mice were pair-fed to FGF1-injected mice. b Rank–rank hypergeometric overlap maps of the degree of overlapping genes between Day 1 and Day 5 (top) and between Day 5 and Day 42 (bottom). Venn diagrams and top overlapping genes (middle panel). Enrichment of Gene Ontology biological process terms of overlapping genes (right panel). c Normalized counts (mean ± SEM, n = 5 mice/group) of the selected glial genes from the bRNA-seq datasets Days 1, 5, and 42 after icv FGF1 or vehicle injection. d Normalized counts (mean ± SEM, n = 5 mice/group) of Agrp, Npy, Mef2c, and Pomc expression Days 1, 5, and 42 after icv FGF1 or vehicle injection. e Targeted relative gene expression of Agrp, Npy, and Pomc. Unpaired t test, two tailed, p = 0.04 (not adjusted, n* = 5 mice/group); ns not significant. Source data are provided as a Source data file. f Threshold-free geneset enrichment analysis (Gene Ontology biological processes terms) of DEGs identified in bRNA-seq data at Days 1, 5, and 42. Point size is scaled by −log10(p value) (Bonferroni adjusted) and is colored based on the normalized enrichment score (NES). g Representative electron microscopic images of synapses of Lepob/ob mice 5 days after icv injection of either vehicle or FGF1. syn synaptic active zone, DCV dense-core vesicle, SV small light-core vesicle. Scale bar 500 nm. Quantification: dots represent mean %DCV/synapse per mouse (25 synapses per animal, n = 4/group). Unpaired t test, two tailed, p* = 0.01 (not adjusted); ns not significant. Source data are provided as a Source data file. Data are presented as mean ± SEM.
ref.