
abstract
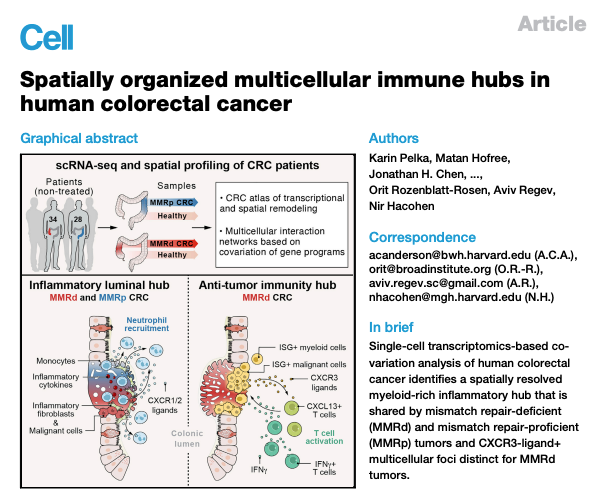
Immune responses to cancer are highly variable, with mismatch repair-deficient (MMRd) tumors exhibiting more anti-tumor immunity than mismatch repair-proficient (MMRp) tumors. To understand the rules governing these varied responses, we transcriptionally profiled 371,223 cells from colorectal tumors and adjacent normal tissues of 28 MMRp and 34 MMRd individuals. Analysis of 88 cell subsets and their 204 associated gene expression programs revealed extensive transcriptional and spatial remodeling across tumors. To discover hubs of interacting malignant and immune cells, we identified expression programs in different cell types that co-varied across tumors from affected individuals and used spatial profiling to localize coordinated programs. We discovered a myeloid cell-attracting hub at the tumor-luminal interface associated with tissue damage and an MMRd-enriched immune hub within the tumor, with activated T cells together with malignant and myeloid cells expressing T cell-attracting chemokines. By identifying interacting cellular programs, we reveal the logic underlying spatially organized immune-malignant cell networks.
methods
scRNA-seq pre-processing and quality control filtering
For droplet-based scRNA-seq, CellRanger v3.1 was used to align reads to the GRCh38 liftover (37 liftover, v28;) human genome reference. The output was processed using the dropletUtils R package (version 1.7.1), to exclude any chimeric reads that had less than 80% assignment to a cell barcode, and identify and exclude empty cell droplets, by testing against a background generated from barcodes with 1,000 to 10 UMIs, with cutoffs determined dynamically based on channel-specific characteristics.
UMI and gene saturation was estimated in individual cells by sub-sampling reads without replacement in each cell barcode, in incremental fractions of 2%, with 20 repeats. A saturation function of the form $ y = \frac{ax}{x+b}+c $ was fit based on the number of UMIs observed while sampling reads at different depths.
Cell barcodes were excluded if they satisfied any one of the following criteria:
(1) Fewer than 200 genes;
(2) Fewer than 1,000 reads;
(3) Fewer than 500 UMIs;
(4) More than 50% of UMIs mapping to the mitochondrial genome;
(5) Non-empty droplet with false discovery rate (FDR) less than 0.1;
(6) Over 5% of reads estimated as coming from swapped barcodes/chimeric reads (available at the supplemental website).
The filtered data was clustered and cells were manually assigned to immune/stromal/epithelial groups based on expressed markers. Using outlier exclusion separately for each channel and each channel cell type combination, cells that deviated by > 2 interquartile ranges (IQR) from the median were then flagged based on the following criteria:
(1) log10(total transcript UMI),
(2) Fraction of barcode swaps,
(3) Gene saturation estimate,
(4) UMI saturation estimate,
(5) Fraction of UMI supported by > 1 read.
Cells were further flagged if they substantially deviated from the fit based on the following relationships:
(1) Total reads versus total UMI,
(2) Total UMI versus log likelihood of being empty;
(3) Total UMI versus total number of genes.
A cell was excluded if it was flagged by at least two of these criteria for epithelial and immune cells, or at least three criteria for stromal cells.
Selection of variable genes, dimensionality reduction and clustering
After filtering and exclusion, scRNA-seq profiles were clustered across all patients using a non-negative matrix factorization (NMF) and a graph clustering-based approach. Transcriptionally over-dispersed genes were identified within each experimental batch (i.e., 10x channel) by the difference of the coefficient of variation (CV) from the median CV for other genes with a similar mean expression.
A robust set of 1,000 to 8,000 genes was retained based on an elbow-based criterion, applied to the median of over-dispersed difference statistics based on 200 samples of 75% of cells.
In all subsequent analysis of single cell data we used log2(TP10K+1) values, calculated for the ith gene in the jth cell as $ g_{ij} = log_{2}(\frac{cij}{\sum_{j}c_{ij}}10^{4}+1) $, unless indicated otherwise.
Next, 80% of genes and samples were sub-sampled between 50 to 200 times, and NMF was used to reduce the dimensionality of the full dataset to between 15 and 40 dimensions as the product of two non-negative matrices. The loading matrices (i.e., activations) of these NMF components were used to calculate the k-nearest neighbors (k-NN) graph (k = 21) based on a cosine similarity distance.
This graph was clustered using stability optimizing graph clustering, to identify 7 top level cell type clusters (epithelial, stromal, mast, B, plasma, myeloid, and T cells).
To minimize differences across samples due to technical reasons (e.g., 10x v2 versus 10x v3), gene expression measurements of individual genes were quantile normalized, separately among cells of each top-level cellular compartment, such that the expression CDFs for each gene matched across all batches.
Next, the same dimensionality reduction by NMF and graph-clustering procedure was applied iteratively to the transcriptomes of each top-level cell type separately, resulting in a total of 88 cell clusters spanning distinct types or states.
Of note, PCA-based louvain clustering leads to qualitatively similar cell subset definition (data not shown). However, since we de-novo discover gene expression programs by NMF, we decided to consistently use NMF instead of PCA also for the cluster definition.
Cluster connectivity
To identify relationships between clusters (‘cluster connectivity’) we used Partition-based Graph Abstraction (PAGA) with connectivity model v1.2 on the NMF based k-NN graph above. PAGA edge thresholds were selected by using the minimum edge weight of the corresponding minimum spanning tree for each k-NN graph.
Cluster assignment by gradient boosting and filtering of potential doublets
In order to exclude potential doublets and low confidence assignments by clustering we used a classifier for final assignment of cells to clusters. Gradient boosting (R 3.6.1, xgboost v0.90.0.2) was first applied to build a cell to cluster classifier for each of the top-level seven cluster types and subsequently to each of the 88 low-level clusters.
During training, we included only high quality cells:
(1) we excluded potential doublets, defined as cells appearing by manual examination between major high-level cell type regions with expression features from both cell types;
(2) cells with possible quality concerns that were not substantial enough for removal during QC;
(3) cells with elevated potential ambient RNA contamination,
retaining 314,524 cells (85%) for final classifier training.
For each of the seven top-level cell types, a separate classifier was trained to predict each cell type separately (one-versus-all), in a 5-fold cross-validation scheme. Next, using the probability scores of the held-out test-set we identified an optimal cutoff for each class based on an ROC analysis comparing the true positive rate (TPR = true positives divided by all positive predictions) to the false positive rate (FPR = true negative divided by all negatives) and selecting the point at which the ROC curve intersects with the diagonal. Cells that were ambiguously assigned in this way to more than one cluster were removed as potential doublets.
Next, a similar classification training scheme was applied separately to cells from each top-level cell type (epithelial, stromal, mast, B, plasma, myeloid, and T cells).
We used 5-fold cross-validation and ROC analysis to select thresholds. In cases where a cell was assigned to more than one subtype, we used the assignment with the higher predictive score. Cells that could not be assigned confidently by any classifier were excluded from further analysis.
Classifying malignant cells by gradient boosting
Adjacent normal tissue, which was sampled distantly from the tumor (e.g., ∼10cm apart), is expected to be tumor-cell free. We used gradient boosting to train a classifier predicting malignant from non-malignant epithelial cells based on the source channel type (tumor versus adjacent normal), in a 5-fold cross validation scheme. We separately trained two classifiers, one predicting isTumor and another predicting isNormal, and used the geometric mean of the resulting probabilities as the final statistic.
In subsequent analyses, we considered epithelial cells from tumor channels with a predicted score greater than 0.75 to be malignant, and cells from normal channels with a predicted score < 0.25 to be normal epithelial cells. Overall, by this measure ∼95% of tumor channel epithelial cells were predicted to be malignant, and 98% of normal channel epithelial cells were predicted to be non-malignant cells. The classifier predictions were highly concordant with those made by inferred copy number alterations with only ∼11% of likely malignant cells showing no substantial copy number differences from normal (8% for MMRp, and 15% for MMRd), and 2% of likely normal cells showing copy number differences (data not shown). Copy number alterations were only determined for epithelial cells.
Identification of gene expression programs by NMF
To identify robust transcriptional programs, we adapted a consensus NMF procedure. We used as input the weight components matrices (W matrices) from an NMF procedure that was run on 50-200 subsampled gene x cell subsets, as described above. We excluded outlier components by sorting components by their cosine distance to the 20th nearest neighbor and excluding components with unusually high distance by an elbow-based criterion.
Next, we constructed a k-NN graph (k = 30), and identified clusters of highly similar components in this graph using stability optimizing graph clustering, with an exponentially varied scale parameter (0.1 to 10). The components in each cluster were median-averaged into a single component, resulting in a shortlist of “consensus NMF” components. These were used as the initialization component matrix for a second round of NMF of all cells and highly variable genes.
The above procedure was applied separately to each top-level cell population and to epithelial cells from normal channels. For each cell type, this resulted in eight solutions, of between 8-48 clusters corresponding to different choices of the resolution parameter. For each cell type, a single solution was selected based on examination of the mean cluster silhouette, inflection of residual error graph, and by manual examination of the top genes in the output programs.
To characterize the expression programs identified with this procedure, we used the top 150 genes in each of the components, ranked by the following weighting scheme: For the ith gene and jth component we define the scaled weight as follows: $WS_{ij}=W_{ij}\max_{k\ne j}log\frac{W_{ij}+1}{W_{ik}+1}$ where $W_{ik}$ is the largest weight for gene i in the rest of the components, i.e., k ≠ j.
This weighting scheme prioritizes for high weight (highly expressed; first term in $WS_{ij}$ formula) and unique genes in each component (second term in $WS_{ij}$ formula). For the visualization of relative gene weights of each gene within a program as circle, weights were scaled to [0,1] range.
Identification of shared gene programs in malignant epithelial cells
To identify expression programs shared across malignant epithelial cells, from multiple individual patients, the above consensus NMF procedure was first applied separately to malignant cells from each patient (cells from tumor channels and classified as malignant as described above). For each patient a separate consensus NMF expression program set (W matrix) was generated, with the number of programs chosen automatically based on the residual error graph.
Next, a similar consensus approach was applied to the combined list of all per-patient consensus NMF program sets (all W matrices, one per patient) as well as a set of 17 normal epithelial programs, in order to capture malignant and normal epithelial programs in a single combined NMF solution.
After this consensus clustering procedure had completed, NMF clusters including one or more normal epithelial programs were excluded and the corresponding normal NMF programs were used in their place. This was done for all specimens (resulting in 43 pEpi programs), and separately for MMRd and MMRp tumors.
Calculating NMF transcriptional program activity
In order to calculate the NMF program activity matrix (H), we used non-negative least-squares (NNLS), solving the following equation for the matrix H, $H=argmin_{H>0}\left|X-WH\right|_{F}$, given X and W, where H is the ‘program activity’ matrix, k is the by cell matrix; X is the gene by cell expression matrix, and W is the gene by k NMF expression program matrix. W was restricted to at most top 100 weighted genes per NMF component. In this way we can calculate the activity values for any cell including cells not part of the original NMF procedure used to discover the program “dictionary”.
Testing for covarying NMF expression programs
We calculated the co-variation of two programs A, B as the correlation (see below) between the vectors of their program activity across the patients, where program activity is calculated by the cell type in which the program was initially defined (e.g., pTNI∗ programs in T/NK/ILC cells). We restricted this analysis to include only patients where at least 1,000 cells were captured and did not consider stromal cells due to their low number per patient (stromal cells account for < 5% of all profiled cells).
In order to capture relationships between expression programs that are active in only a small number of cells, we calculated for each patient, cell type, and expression program, the program activity values in this cell type at five quantiles (0.25 0.5, 0.75, 0.95, 0.99).
We then calculated the Pearson correlation coefficient, R, for every pair of NMF programs, separately for each quantile across patients. The correlation for each quantile was Fisher transformed (i.e., arctanh(R)) and the mean of the five values was used as a test statistic and compared against a null distribution of mean Fisher transformed R values generated by permuting the patient ID assignment (and keeping cell type, and overall NMF value distribution unchanged). A p value was calculated by counting how often the permuted R is above the true observed R (p = (# R > R’)/(# permutations), and separately how often the permuted R is below the observed R. The minimum of these (scaled by two) was taken as the outcome empirical p value statistic and reported at a Benjamini-Hochberg FDR of 10%. We report the raw correlation at the 0.75 quantile and the adjusted R, calculated as the difference of mean true R values, and the mean of permuted R values across 10,000 permutations. We constructed a signed weighted network from the pairwise R values retaining only significant edges (FDR < 0.1).
Next, we discovered modules (‘hubs’) in the resulting network using a module detection algorithm for signed graphs (i.e., having both negative and positive edges). This method explores a space of solutions set by a resolution parameter in the range 0.001 to 0.2, and a random-walk parameter (tau = 0.2), and outputs the optimal solution based on the Constant Potts Model of graph modularity. We applied this method iteratively, and split modules if they were larger than 3 nodes and improved the signed weighted modularity of the solution.
Constructing a network of expression program similarity
A network of expression program similarities was constructed for pTNI∗, pS∗, pM∗, and pEpi∗ programs by calculating for every pair of program genes a pairwise Jaccard similarity (i.e., for sets A and B J = |A intersect B|/|A union B|) of the top 50 program genes. The resulting similarity matrix was used to construct a Gaussian kernel matrix (as in constructing a tSNE, with perplexity of 30 and a tolerance of 10−5). The kernel matrix was filtered to retain the top 4% of value pairs to construct the final network, and visualized using a force-directed layout algorithm.
Visualization of single cell profiles
We generated tSNE plots per compartment from NMF loading matrices, with a perplexity value of 30 and the Barnes-Hut approximation method. A global tSNE of all cells was generated using Pegasus with the default parameters and using SVD for the preliminary embedding.
Identification of differentially expressed genes
Differentially expressed genes (DEGs) were identified using a two-step procedure applied to the log(TP10K+1) values, first using a Mann-Whitney-Wilcoxon Ranksum test, and then sorting genes by Wilcoxon statistic, and testing each of the top 1,000 genes for differential expression using a generalized linear mixed model using a normal distribution, with terms for the total UMI and the total number of genes, and a fixed effect intercept term for each patient. We report the likelihood ratio Wald-test p value comparing this model to one also including a categorical class term.
Genes were identified as differentially expressed in a particular set of cells if they met all of the following criteria:
(1) Ranksum test with a Benjamini-Hochberg FDR < 0.1;
(2) Minimum expression in at least 5% of cells;
(3) Area Under a Receiver Operating Curve (AUROC) > 0.55,
(4) 1.25 log fold change versus all other cells;
(5) Wald-test with a Benjamini-Hochberg FDR < 0.1.
We included tables for the top 100 significant genes (sorted by AUCROC), for immune, stromal and epithelial cells (Tables S2, S3, and S4).
Pearson residual calculation in contingency tables
Enrichment/depletion of particular cell clusters compared to adjacent normal colon tissue (as shown in Figures 200945-4?_returnURL=https%3A%2F%2Flinkinghub.elsevier.com%2Fretrieve%2Fpii%2FS0092867421009454%3Fshowall%3Dtrue#fig2)A, 300945-4?_returnURL=https%3A%2F%2Flinkinghub.elsevier.com%2Fretrieve%2Fpii%2FS0092867421009454%3Fshowall%3Dtrue#fig3)B, and S200945-4?_returnURL=https%3A%2F%2Flinkinghub.elsevier.com%2Fretrieve%2Fpii%2FS0092867421009454%3Fshowall%3Dtrue#figs2)B) were determined using the Pearson residual. The Pearson residual is a measure of relative enrichment for cells in a contingency table. It is calculated here as: $R=\frac{obs-exp}{\sqrt{exp}}$, where the expected value is calculated as the product of row and column marginal probabilities by the total count.
Transcription factor target enrichment in gene expression programs
Transcription factor target gene predictions are aggregated from the following database:
(1) Trrust (v2; https://www.grnpedia.org/trrust/),
(2) MsigDB (v.7.1; http://www.gsea-msigdb.org/gsea/msigdb/),
(3) RegNetwork web (http://regnetworkweb.org/).
TF target sets were tested for statistical enrichment within the top genes of each program using the Fisher-exact test. A TF was considered a putative regulator of an NMF program if it showed significant enrichment (FDR < 0.1), had an overlap of at least 3 genes between the top NMF program genes and TF targets, and if the TF gene expression showed a positive correlation with the respective NMF activity.
Figure
Fig 1. Cohort and atlas of cell subsets and programs in MMRd and MMRp CRC
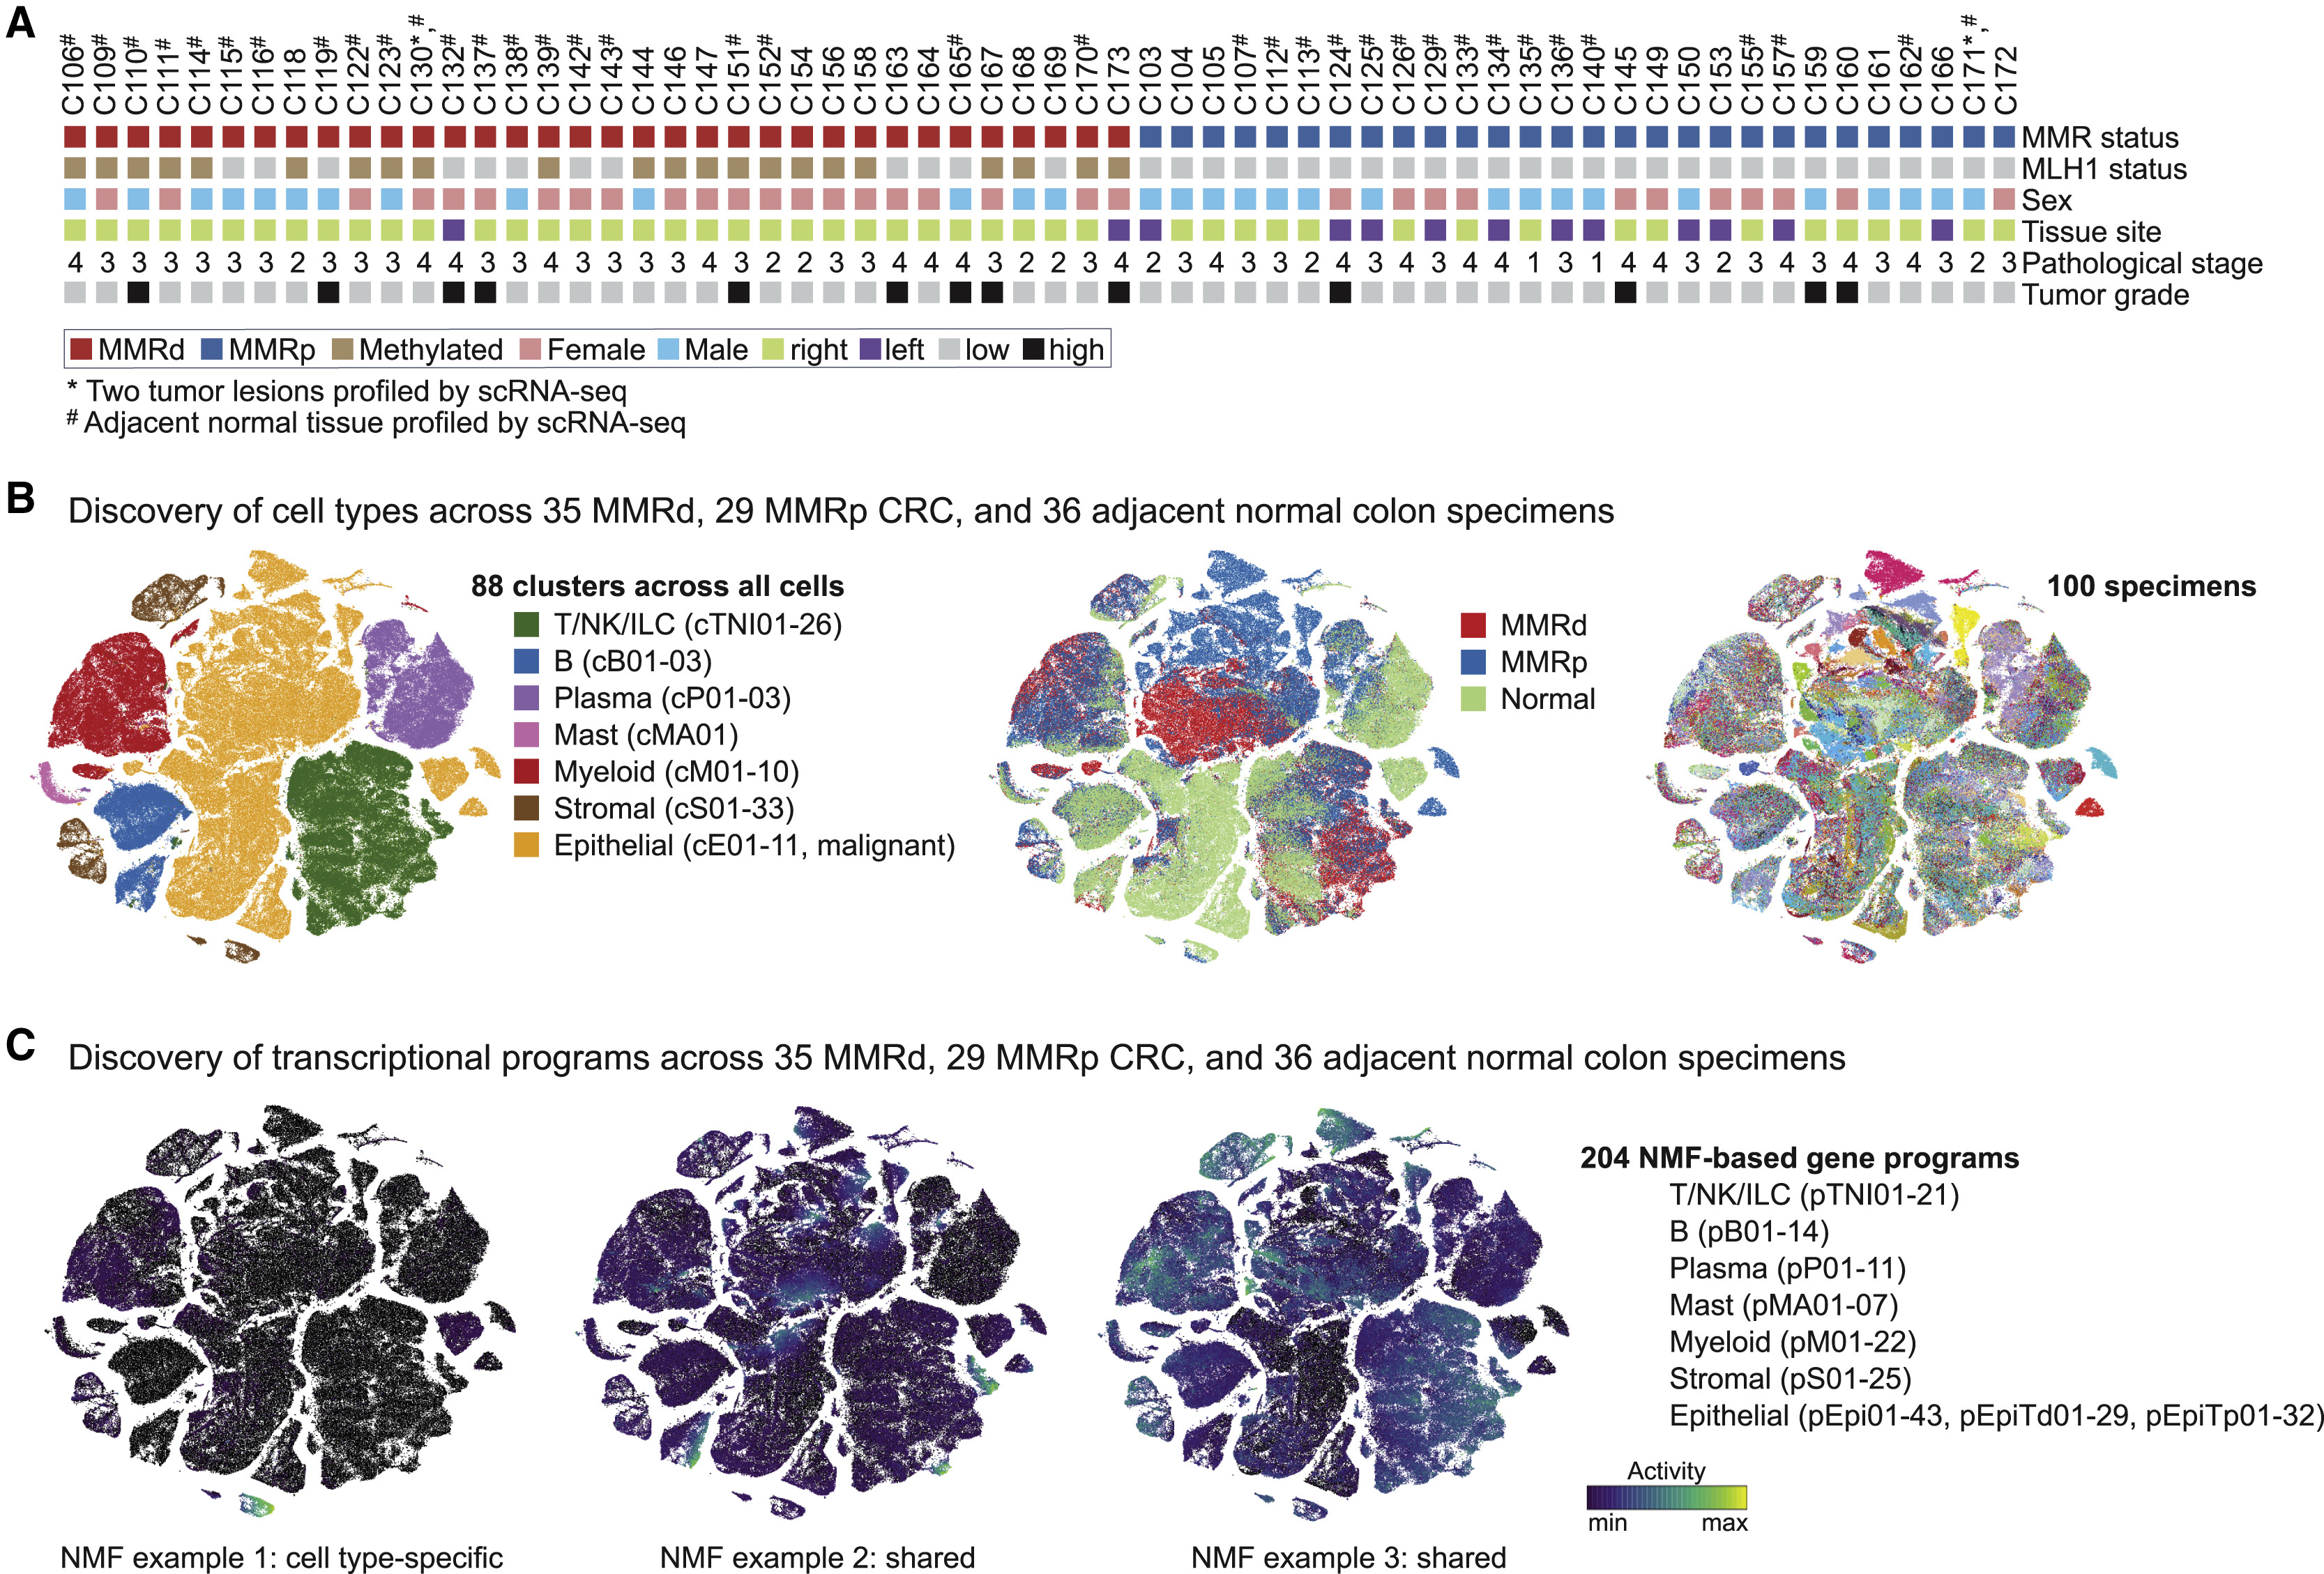
(A) MMR status and clinical characteristics of primary untreated individuals with CRC.
(B) tSNEs (t-distributed stochastic neighbor embedding) by major cell partitions (left), tissue type (middle), or specimen (right).
(C) NMF-based gene programs can be cell type specific (example 1, pS02-Fibro matrix/stem cell niche) or shared (example 2, pTNI03-proliferation; example 3, pEpi30-ISGs).
Fig 2. The immune compartment in MMRd and MMRp CRC
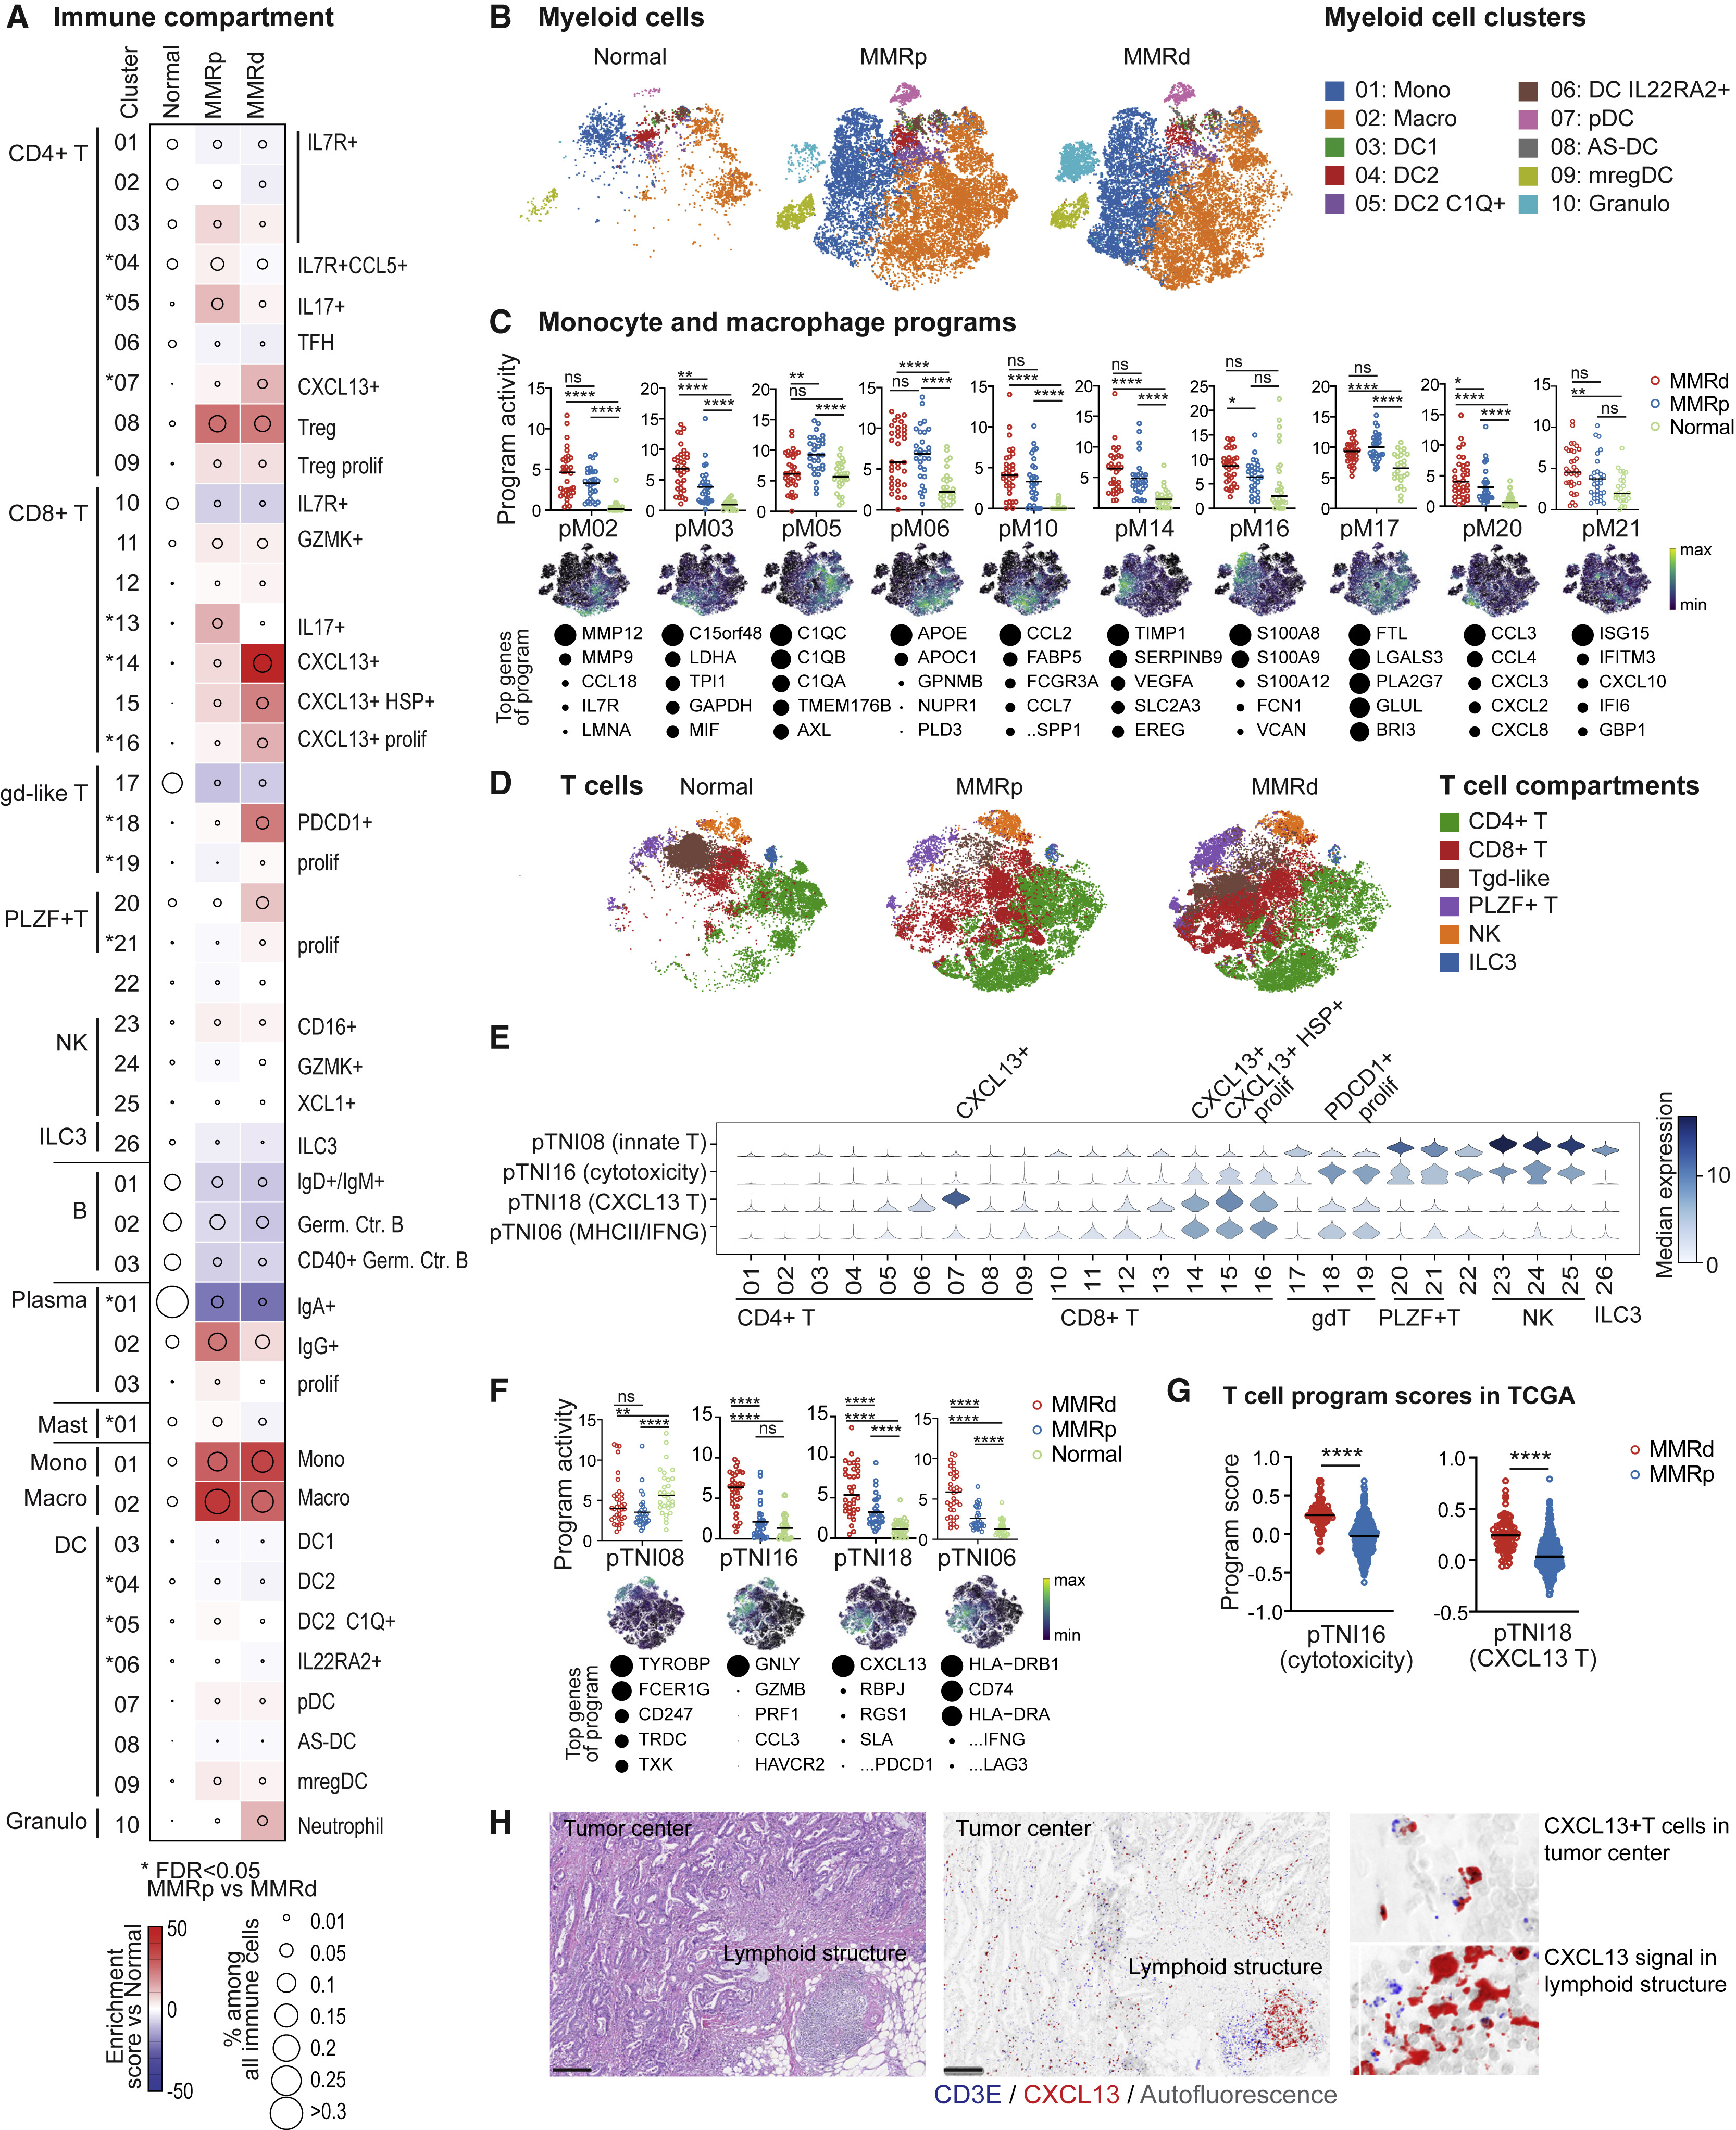
(A) Compositional changes in immune cell clusters in MMRp and MMRd tumors relative to adjacent normal tissue. Kruskal-Wallis false discovery rate (FDR) < 0.05 for MMRp versus MMRd are marked with asterisks.
(B) tSNEs of myeloid cells in all normal and tumor samples.
(C) Activities of selected myeloid gene programs with high activities in monocytes and macrophages. Each dot indicates the 75th percentile of the program activity in the myeloid cells of one specimen. GLME (generalized linear mixed model) FDR: ∗∗∗∗ ≤ 0.0001, ∗∗∗ ≤ 0.001, ∗∗ ≤ 0.01, ∗ ≤ 0.05, not significant (ns) for > 0.05. tSNEs below show program activities within the myeloid compartment. For each program, the top genes are listed below, with circle size indicating the relative weight of each gene within the program.
(D) tSNEs of the T/NK/ILC cell partition colored by major cell subsets.
(E) pTNI08, pTNI16, pTNI18, and pTNI06 activities within each of the T/NK/ILC cell clusters.
(F) pTNI08, pTNI16, pTNI18, and pTNI06 activities displayed as in (C). GLME FDR reported as in (C).
(G) pTNI16 and pTNI18 gene signature scores in bulk RNA-seq from TCGA-CRC (COADREAD, colon and rectum adenocarcinoma) specimens. Mann-Whitney-Wilcoxon test, ∗∗∗∗p ≤ 0.0001.
(H) Localization of CXCL13+ T cells in tumor center versus lymphoid structure. Left: H&E. Right: CD3E and CXCL13 RNA in situ hybridization (ISH). Scale bar, 200 μm.
Fig 3. Stromal remodeling in MMRd and MMRp CRC
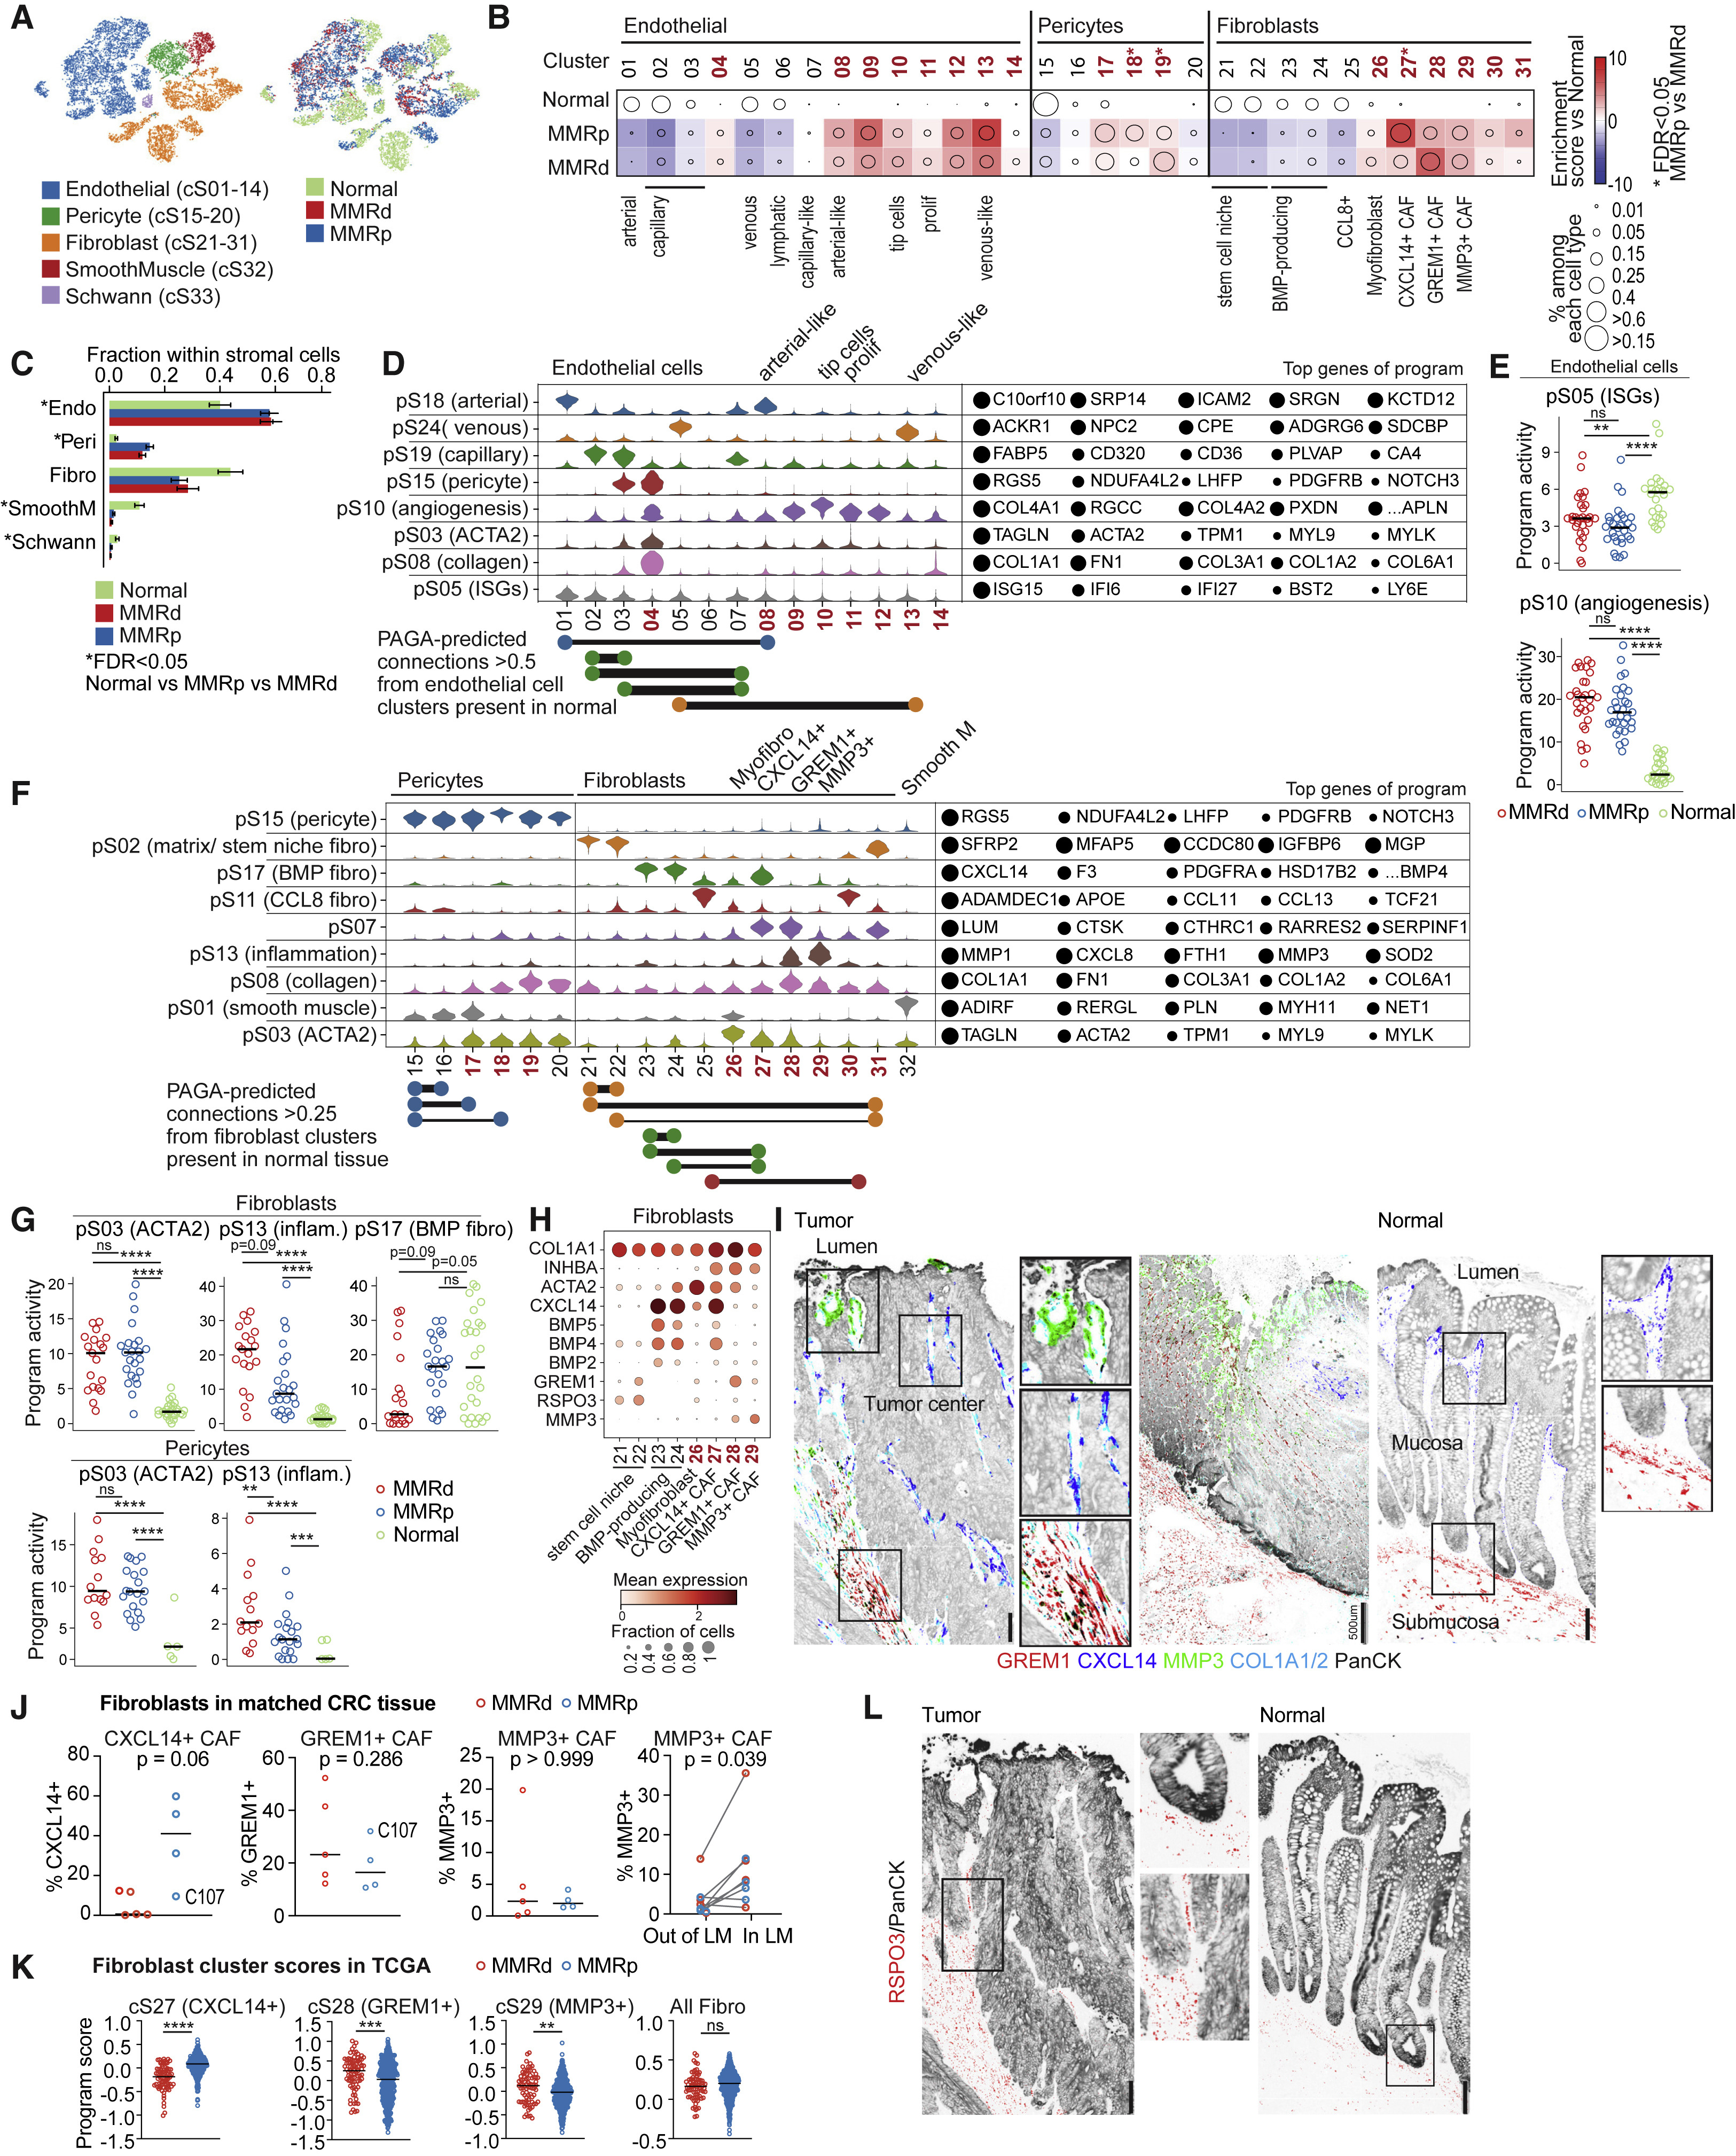
(A) tSNEs of stromal cells in all normal and tumor samples.
(B) Compositional changes in endothelial, pericyte, and fibroblast subsets within their respective compartments in MMRp and MMRd tumors relative to adjacent normal tissue. Tumor-enriched clusters are indicated in bold red. Kruskal-Wallis FDR < 0.05 for MMRp versus MMRd are marked with asterisks. cS30 and cS31 are overwhelmingly from two tumors that grew below non-neoplastic tissue and may not be purely tumor derived.
(C) Fraction of stromal cell subsets per tissue type (mean ± SEM with each specimen being one data point). Kruskal-Wallis FDR < 0.05 for normal versus tumor are marked with asterisks.
(D) Activities of selected programs in each of the endothelial cell clusters. Tumor-enriched clusters are indicated in bold red. Top program genes are listed to the right, with circle size indicating the weight of each gene in the program. Key edges (connectivity) between two normal or one normal and one tumor-associated cluster (weights > 0.5, identified by PAGA) are shown below, and colors are matched to programs with high activity in the respective clusters.
(E) Activity of pS05 (ISG) and pS10 (angiogenesis) in all tumor and normal samples. Each point indicates the 75th percentile of the program activity per specimen in endothelial cells. GLME FDR: ∗∗∗∗ ≤ 0.0001, ∗∗∗ ≤ 0.001, ∗∗ ≤ 0.01, ∗ ≤ 0.05, ns for > 0.05.
(F) Selected programs in fibroblast and pericyte subtypes shown as in (D). Shown below are PAGA-based connectivity weights > 0.25.
(G) Activities of pS03 (ACTA2), pS13 (inflammation), and pS17 (BMP fibro) in fibroblasts and pS03 and pS13 in pericytes, shown as in (E).
(H) Dot plot showing geometric mean expression (log(TP10K+1)) and frequency (dot size) of key genes in selected fibroblast subtypes. INHBA distinguishes cancer-associated fibroblasts (CAFs) from fibroblasts in normal tissue. Tumor-enriched clusters are indicated in bold red.
(I) Representative RNA ISH/immunofluorescence (IF) images of tumor show MMP3+ fibroblasts at the luminal surface around dilated vessels, CXCL14+ fibroblasts lining malignant cells, and GREM1+ fibroblasts in stromal bands reaching far into the tumor (left image). In tumors, GREM1+ fibroblasts additionally line malignant epithelial cells (center). In normal tissues (right), GREM1 signal is restricted to in and below the muscularis mucosa, while only CXCL14+ fibroblasts line the epithelial cells. Scale bar, 100 μm (except where annotated).
(J) Quantification of CXCL14+, GREM1+, and MMP3+ CAFs among COL1A1/COL1A2+ fibroblasts based on whole-slide scans of 5 MMRd and 4 MMRp CRC specimens from (I); Mann-Whitney-Wilcoxon test. Rightmost graph: MMP3+ cells among all COL1A1/COL1A2+ cells outside or inside of the LM (defined as ≤ 360 μm from the luminal border of the tumor); Wilcoxon matched-pairs signed rank test. Only 8 samples are included on the right because one clinical paraffin block did not contain LM.
(K) Gene signature scores of top differentially expressed genes from CXCL14+ CAFs, GREM1+ CAFs, MMP3+ CAFs, and all fibroblasts in bulk RNA-seq from TCGA-CRC (COADREAD). Mann-Whitney-Wilcoxon test: ∗∗∗∗p ≤ 0.0001, ∗∗∗p ≤ 0.001, ∗∗p ≤ 0.01, ∗p ≤ 0.05, ns for > 0.05.
(L) RNA ISH/IF staining for RSPO3 on consecutive sections to those shown in (I) shows that the RSPO3 signal is restricted to the crypt base in normal tissue (right image and top inset) but ascends far into the tumor (left image and bottom inset). Scale bar: 100um.
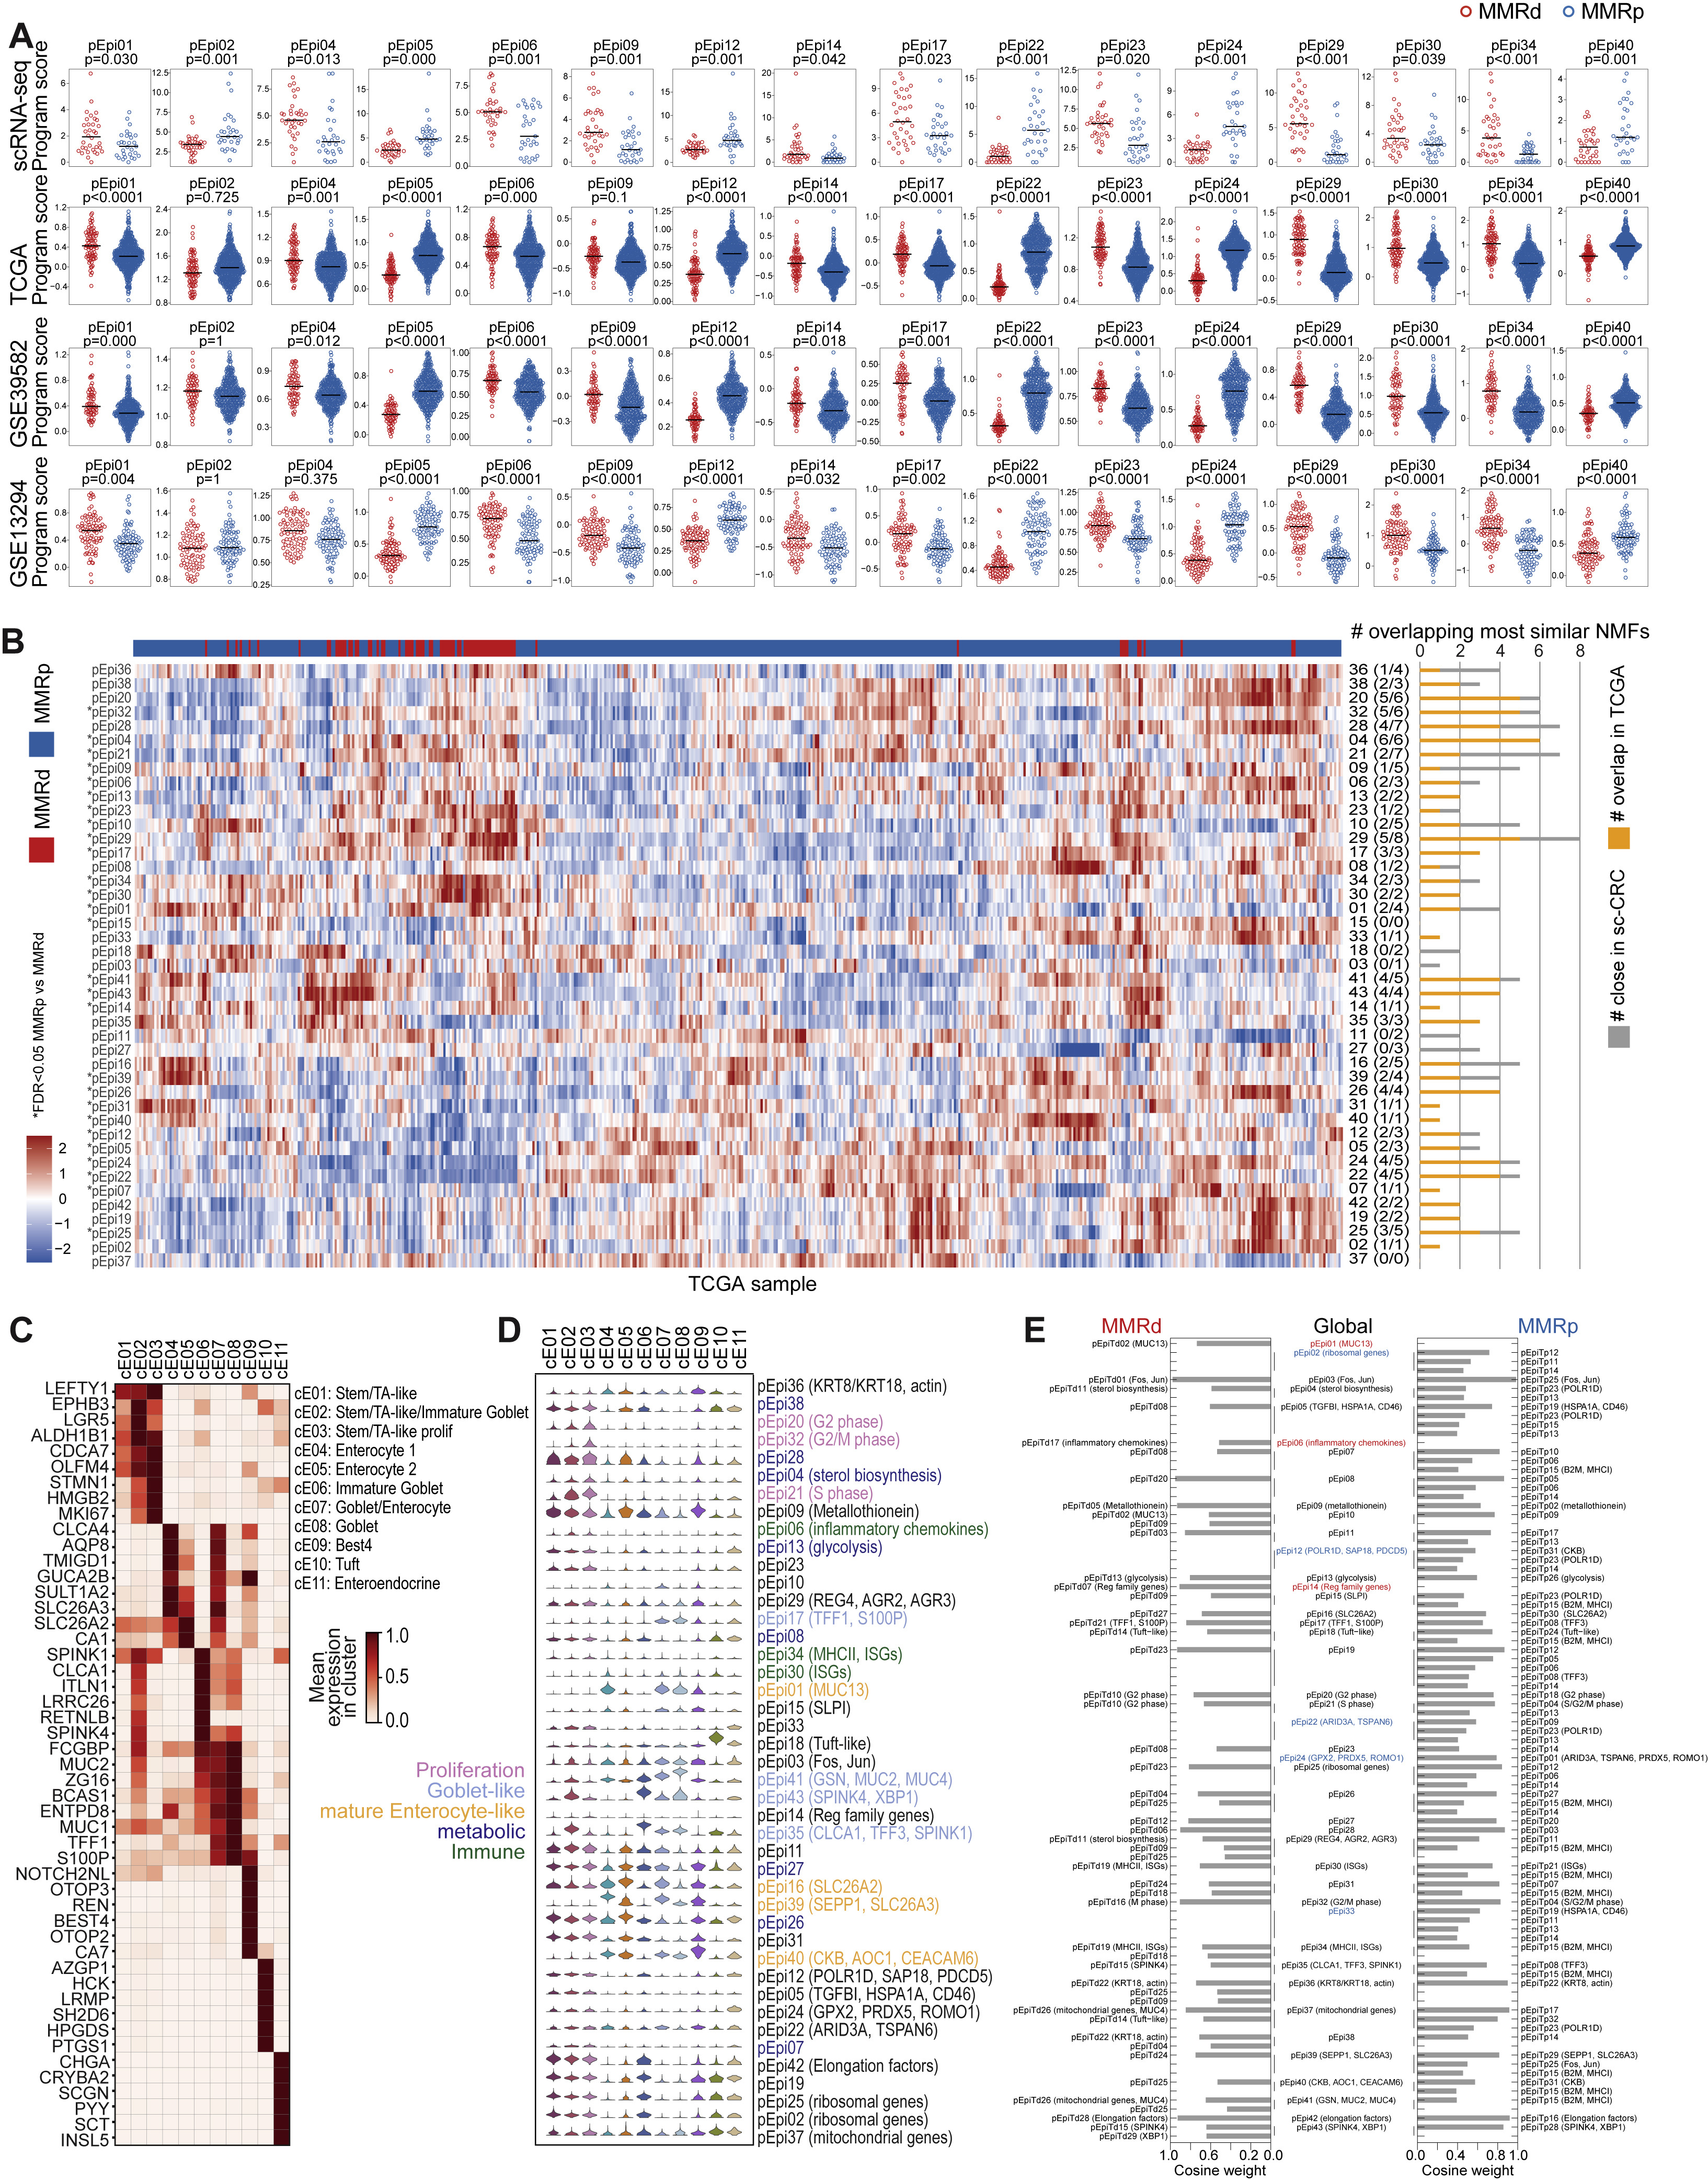
fig 4. Transcriptional programs in malignant cells differ between MMRd and MMRp CRC
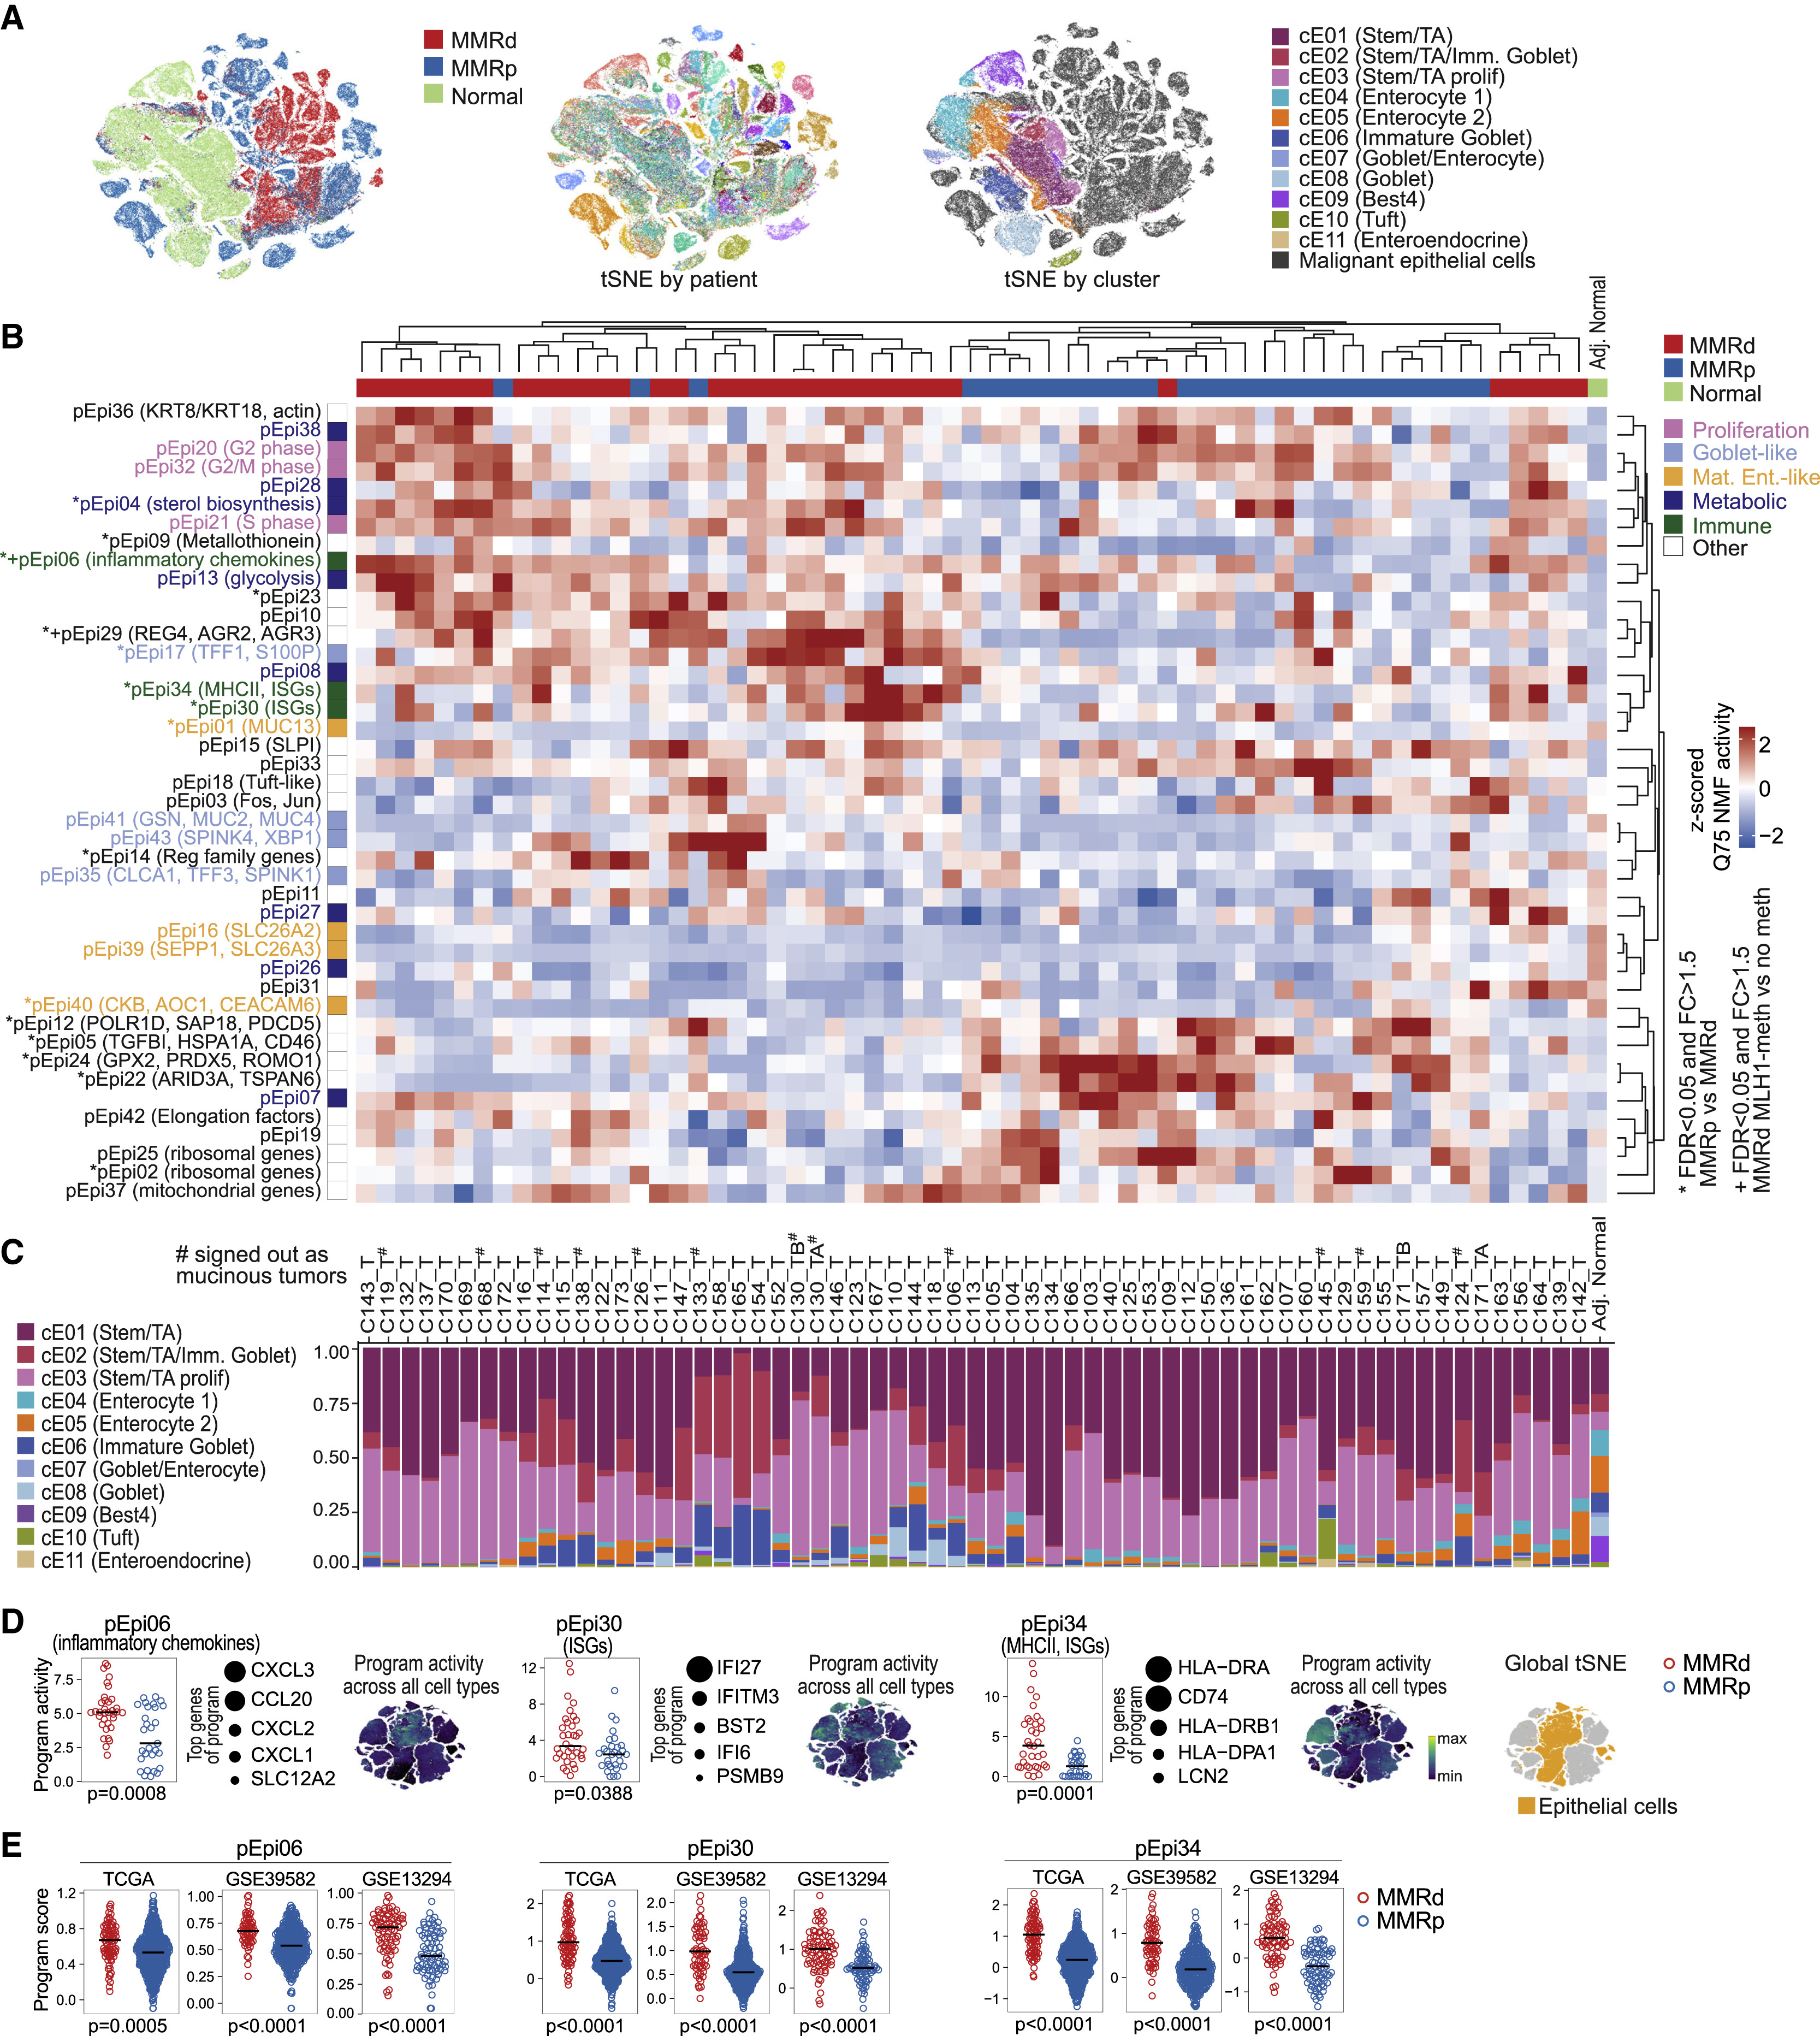
(A) tSNEs of epithelial cells by tissue type (left), individual (middle), and cell type (right).
(B) Heatmap showing the 75th percentile of activities from the 43 malignant programs in malignant cells across CRC specimens (rows centered and Z scored), hierarchically clustered using average linkage. Gene program activity in normal epithelial cells is shown for comparison (rightmost column). Significant differences in MMRd versus MMRp are indicated by asterisks (GLME, individual as random effects, MMR status as fixed effect, FDR < 0.05). Significant difference between MLH1 promoter-methylated versus MLH1-non-methylated MMRd specimens is indicated with +.
(C) Inferred cell type composition of malignant cells in each tumor specimen, classified by supervised learning trained on non-malignant epithelial cells. Epithelial cell composition in normal tissue is shown for comparison (rightmost bar). Morphologically mucinous tumors are indicated with #. Individual order is the same as in (B).
(D) Selected immune-related transcriptional programs in epithelial cells with significantly different activity in MMRd versus MMRp CRC (GLME FDR < 0.05). For each program, the top genes are shown, and circles indicate the relative weight of each gene in the program. tSNEs show program activities across all cell types (global tSNE); location of epithelial cells is indicated on the right in yellow.
(E) Signature gene scores for programs in (D) in bulk RNA-seq from TCGA-CRC(COADREAD), GSE39582, and GSE13294 specimens. Mann-Whitney-Wilcoxon test: ∗∗∗∗p ≤ 0.0001, ∗∗∗p ≤ 0.001, ∗∗p ≤ 0.01, ∗p ≤ 0.05, ns for > 0.05.
fig 5. Discovery of multicellular interaction networks in MMRd CRC

(A) Heatmap showing permutation-adjusted pairwise correlation of gene program activities (co-variation score) across MMRd specimens (STAR Methods) using specimen-level activities in T/NK/ILC cell, myeloid, and malignant compartments. Significance is determined using permutation of patient ID and indicated with asterisks (FDR < 0.1). Densely connected modules (hubs) are identified based on graph clustering of significant correlation edges.
(B) Jaccard similarity of gene programs calculated based on the overlap of top weighted genes across T/NK/ILC, stromal, myeloid, and malignant cells. Edge thickness is proportional to program similarity. Edges from selected network neighborhoods are colored and annotated by function.
Fig 6. An inflammatory hub at the luminal surface of primary MMRd and MMRp tumors
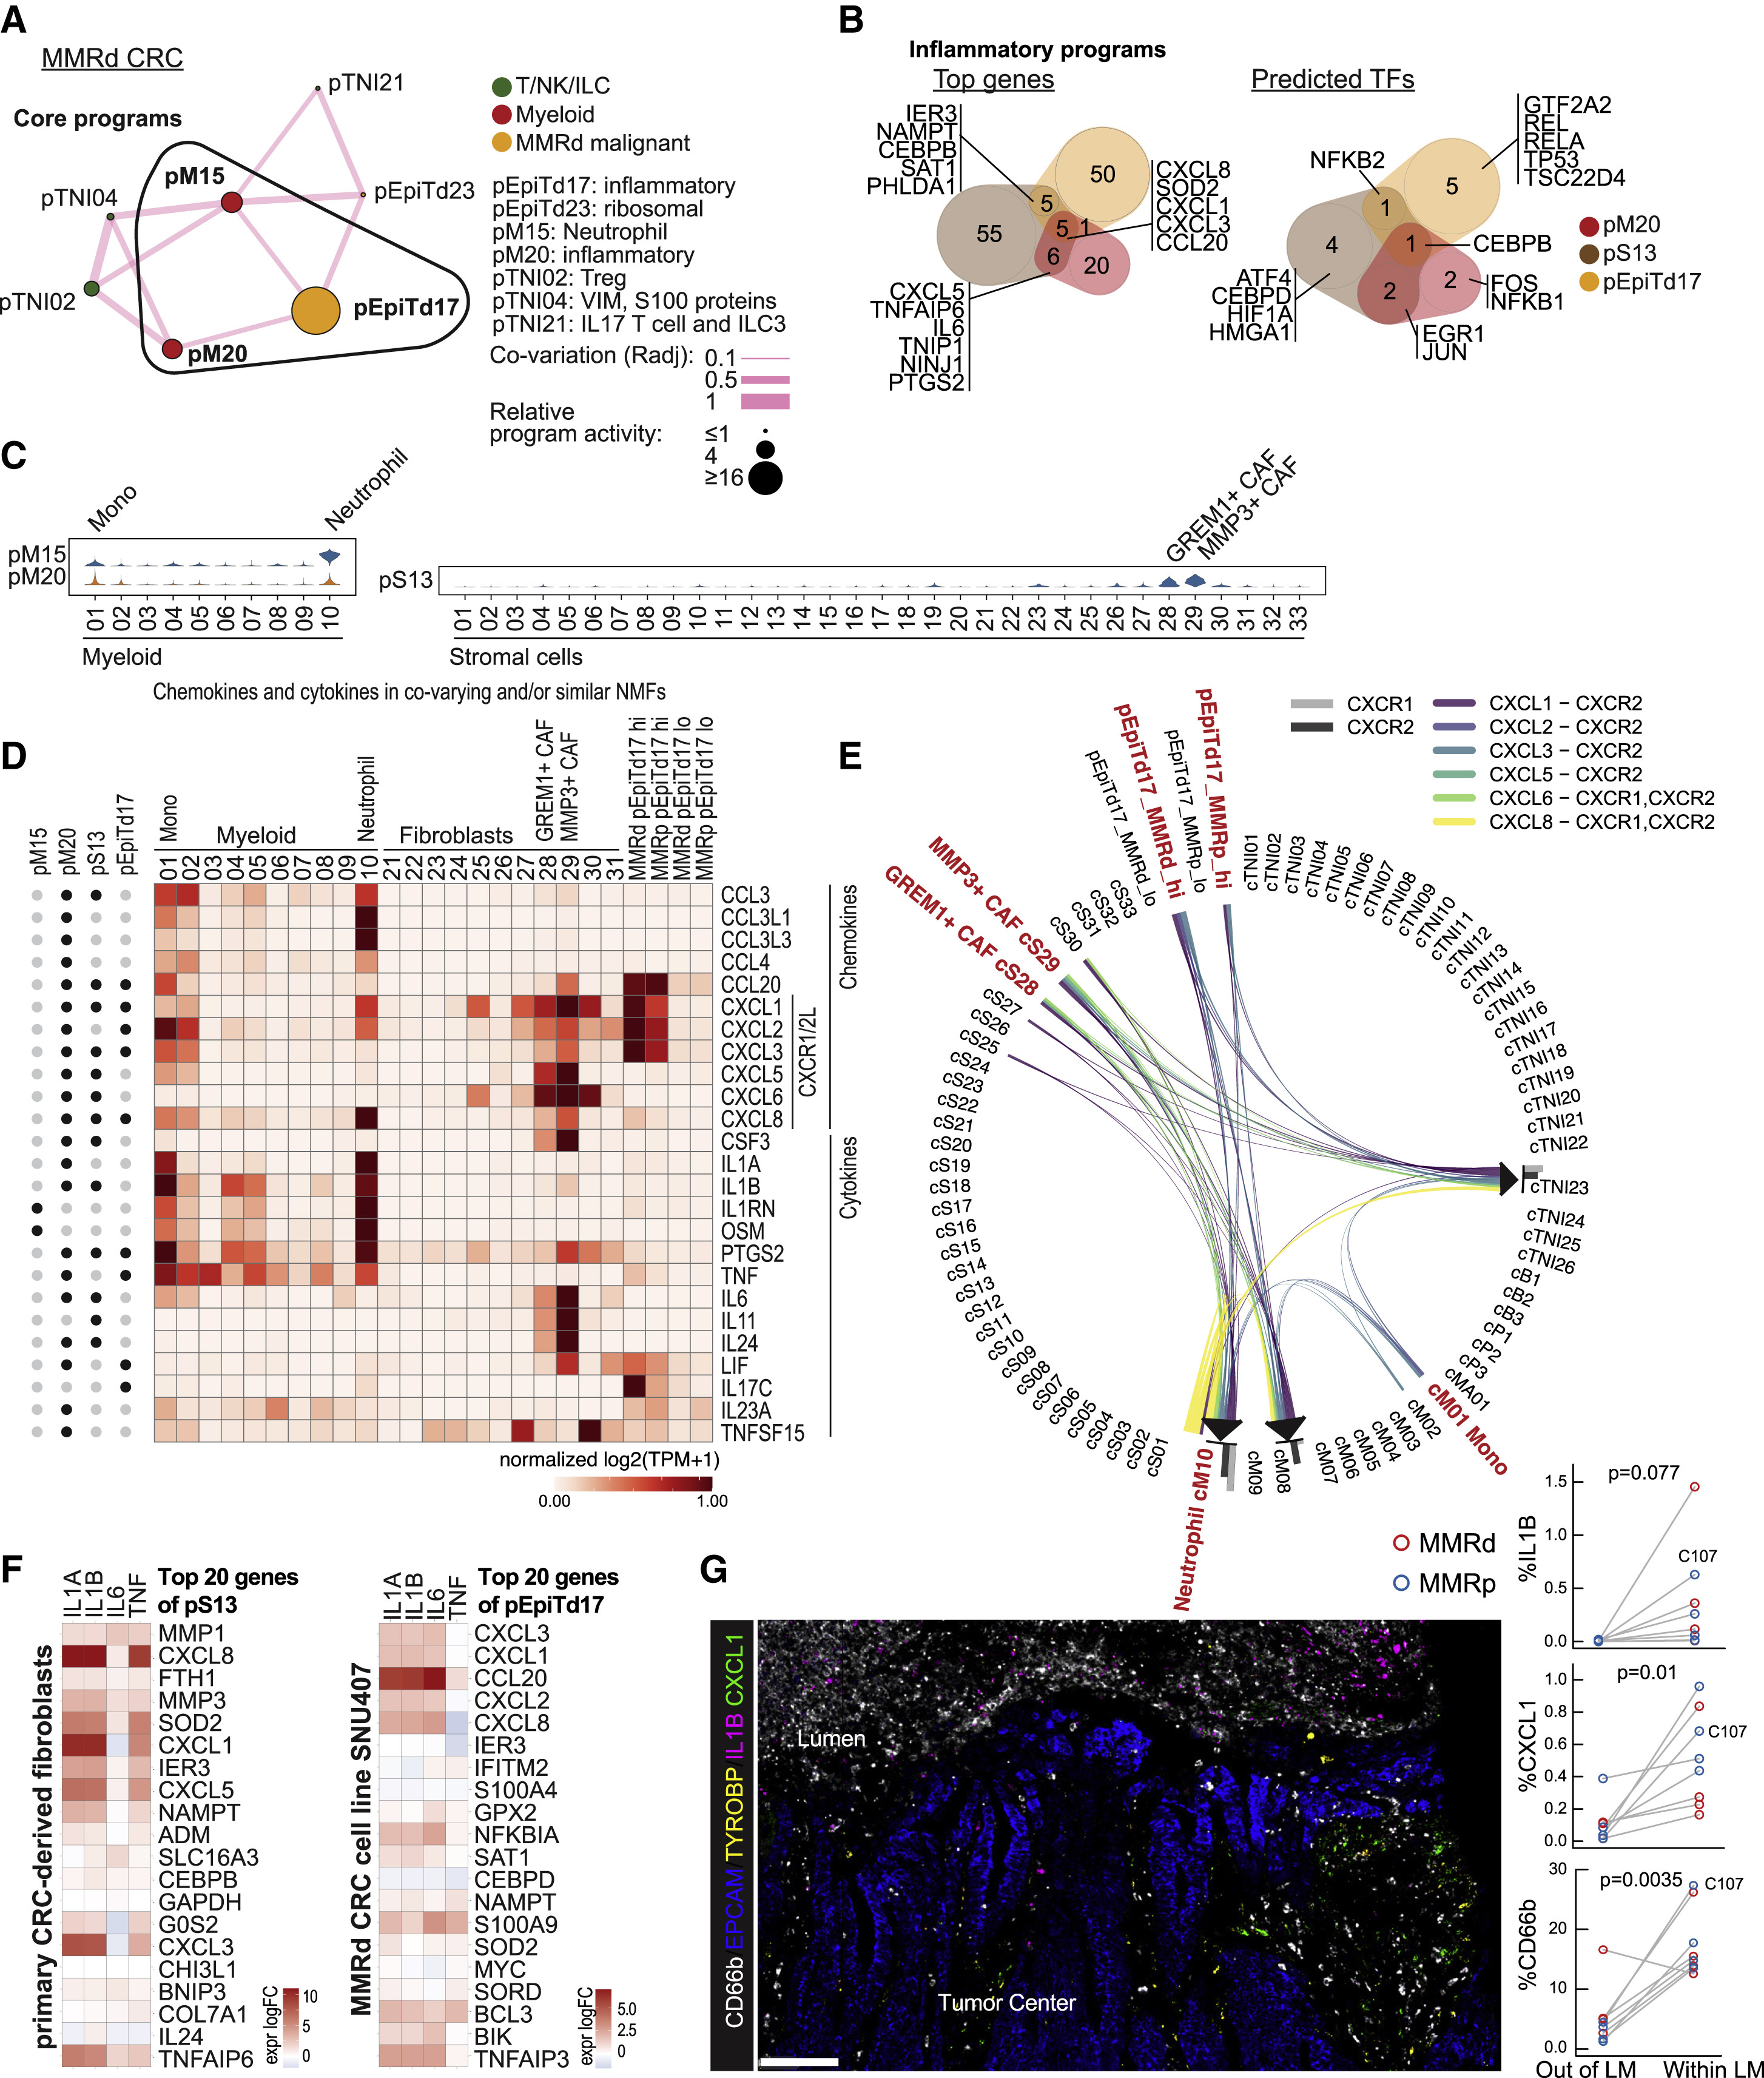
(A) Inflammatory hub 3 in MMRd specimens. Nodes respresent gene programs, and the size of each node is proportional to the log ratio of the respective mean program activity in MMRd versus normal. Edge thickness is proportional to co-variation.
(B) Venn diagrams showing the overlap of top weighted genes (left) and predicted transcription factors (right) for inflammatory gene programs in myeloid, stromal, and malignant compartments.
(C) Violin plots showing program activities of pM15 and pM20 across myeloid cell clusters and pS13 activity across stromal cell clusters.
(D) Expression level of all chemokines and cytokines present in the top genes of the depicted NMF-based programs (indicated with black dot on the left) across the specified clusters and malignant cells with high versus low pEpiTd17 program activity. Genes are normalized across all cell clusters in the dataset (not only clusters shown).
(E) Interactions between CXCR1/2 and cognate chemokines. Clusters with high activity for the co-varying or similar inflammatory gene programs are marked in red.
(F) Primary CRC-derived fibroblasts and SNU-407 MMRd CRC cell line were stimulated with 10 ng/ml IL-1A, IL-1B, IL-6, or tumor necrosis factor (TNF) for 14 h or not treated. Transcriptional signatures were determined by RNA-seq. Shown are log fold changes compared with unstimulated cells. Data are representative of 2 independent experiments each.
(G) Representative RNA ISH/IF image shows accumulations of neutrophils (CD66b-IF) and IL1B and CXCL1 ISH signals at the malignant interface (EPCAM-ISH) with the colonic lumen. Myeloid cells are marked by TYROBP-ISH. Scale bar, 100 μm. Right: quantification of cell phenotypes in 8 CRC specimens (one clinical paraffin block did not contain LM) shows IL1B, CXCL1, and neutrophil (CD66b) signals enriched in the LM, defined as ≤ 360 μm from the luminal border of the tumor. Paired two-tailed t test. Individual C110 does not show CD66b enrichment at the LM.
Fig 7. A coordinated network of CXCL13+ T cells with myeloid and malignant cells expressing ISGs
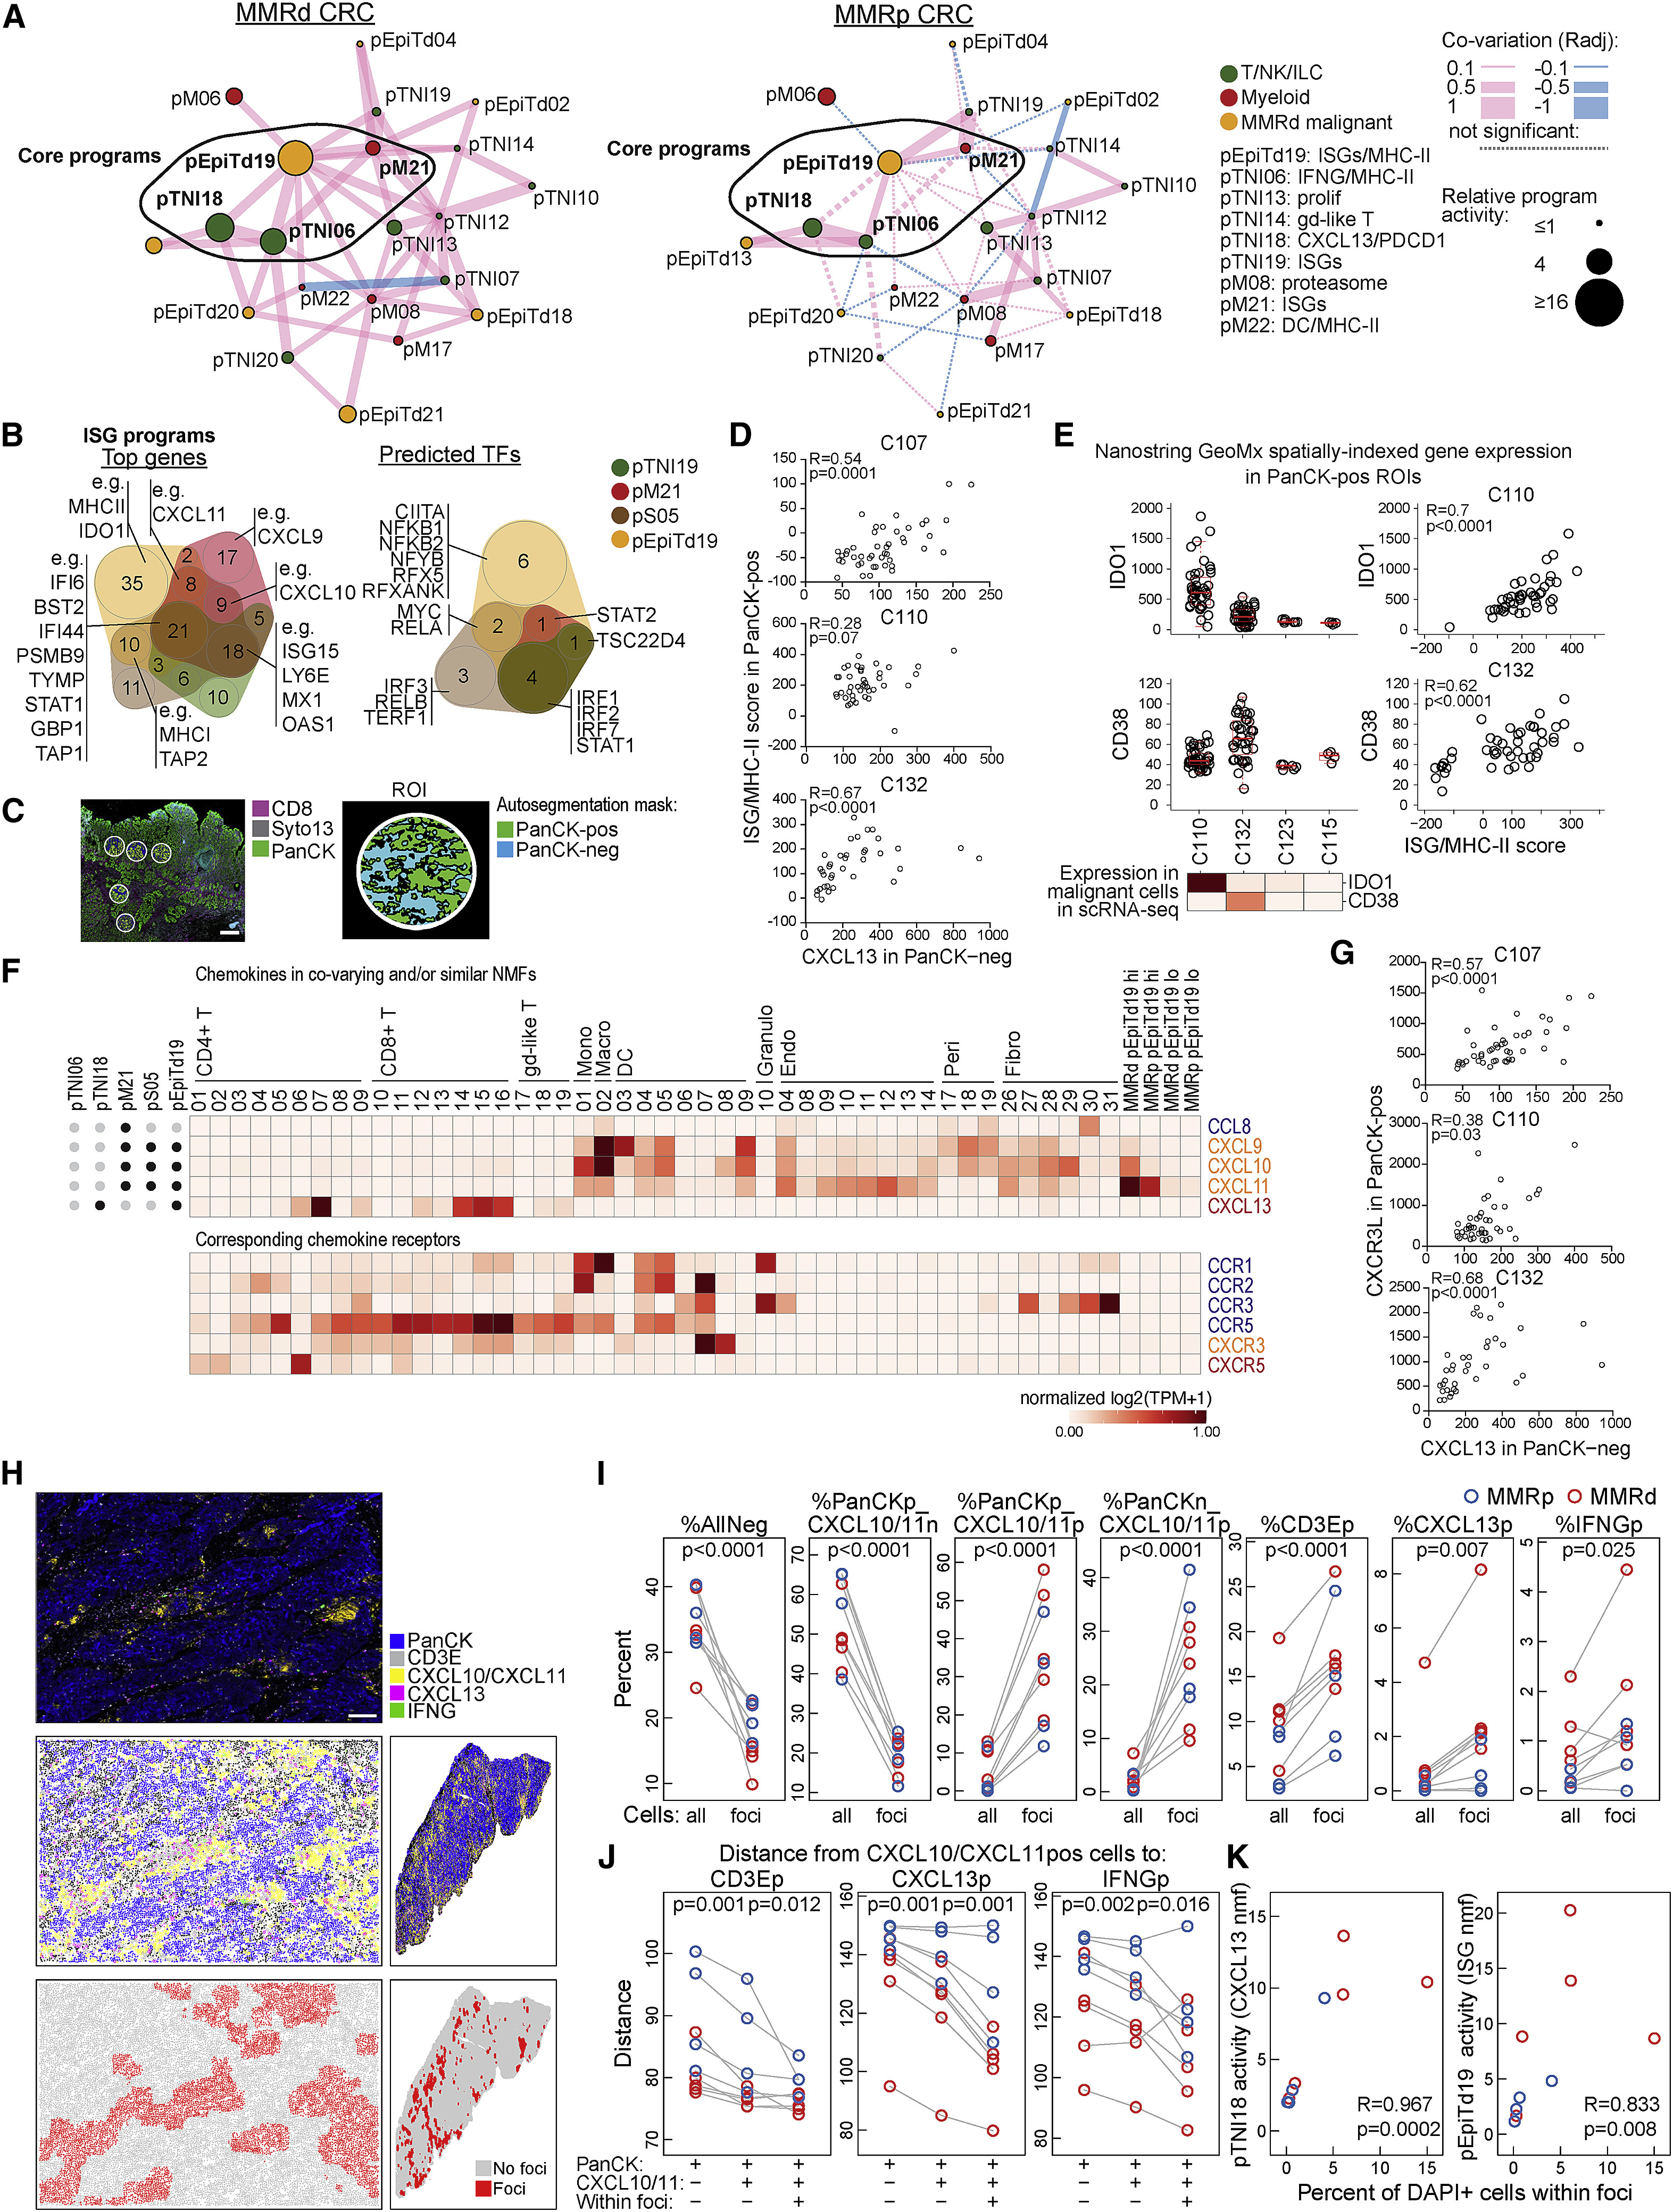
(A) Hub 6 in MMRd specimens (left) and projected onto MMRp specimens (right). Nodes respresent gene programs, and the size of each node is proportional to the log ratio of the respective mean program activity in MMRd or MMRp versus normal. Edge thickness is proportional to co-variation. Pink lines depict positive and blue lines negative correlations. Non-significant edges are depicted as dotted lines.
(B) Overlap of top weighted genes (left) and predicted transcription factors (right) for ISG programs in T/NK/ILC cell, myeloid, stromal, and malignant compartments.
(C) Image shows a portion of the tissue from individual C110 with regions selected for spatially indexed transcriptomics (GeoMx DSP CTA). ~45 regions of interest (ROIs) per specimen were sampled, and each ROI was auto-segmented into PanCK-positive and -negative regions. Scale bar, 500 μm.
(D) Three CRC specimens with high CXCL13 activity (C110, C132, and C107) were analyzed by spatially indexed transcriptomics (GeoMx DSP CTA) as described in (C). CXCL13 signal in PanCK-negative regions was correlated to an ISG/MHC-II signal score (STAR Methods) in the paired PanCK-positive regions (Spearman correlation).
(E) Quantification of the NanoString GeoMx Digital Spatial Profiler (DSP) Cancer Transcriptome Atlas (CTA) assay showing high IDO1 expression in malignant cells of individual C110 and high CD38 expression in malignant cells of C132, consistent with scRNA-seq data (heatmap, log2(TP10K+1)). Right: Spearman correlation between IDO1 (top) or CD38 (bottom) expression and ISG/MHC-II scores (as calculated in D) in malignant cells of the respective individuals.
(F) All chemokines present in the top genes of the depicted NMF-based programs (indicated by black dot at left) as expressed in the depicted clusters and malignant cells with high versus low pEpiTd19 program activity. Genes are normalized across all cell clusters in the dataset (not only the clusters shown).
(G) GeoMx DSP CTA assay as in (D), showing Spearman correlation of CXCL13 signal in PanCK-negative regions with CXCR3 ligand expression (i.e., sum of CXCL9, CXCL10, and CXCL11) in the paired PanCK-positive regions.
(H) PanCK-IF, CD3E-ISH, CXCL10/CXCL11-ISH, CXCL13-ISH, and IFNG-ISH were performed on 9 tumor tissue slides from different donors (MMRd, n = 5: C110, C123, C132, C139, C144; MMRp, n = 4: C103, C112, C126, C107). Cells were phenotyped using Halo software. An image section from C123 is shown (top), as well as a computational rendering of the same section (center left) and the full slide (center right). Cells were characterized by a 100-μm neighborhood and clustered by their neighborhood features to identify “foci” and “no foci.” Scale bar, 100 μm.
(I) Based on the approach in (H), percentages of the indicated phenotype (p, positive; n, negative) among all DAPI+ cells or DAPI+ cells within the foci were calculated. CXCL10/CXCL11p, CD3Ep, CXCL13p, and IFNGp cells are significantly enriched in foci (paired two-tailed t tests).
(J) Distances were calculated from CXCL10/CXCL11-positive cells to the indicated phenotypes (mean distance across 100-μm neighborhoods) outside or inside the foci. If a phenotype was not observed in the 100-μm neighborhood, the distance was set to 150 μm. p values for paired two-tailed t tests are shown.
(K) Percentage of cells within foci (among all DAPI+ cells) was correlated to scRNA-seq-based pTNI18 and pEpiTd19 activities from the respective specimens (Spearman correlation).
Fig S1. Cellular composition of the scRNA-seq dataset and use of NMF and gene expression programs in our analysis pipeline

(A) Number of cells in immune (T/NK/ILC, B, Plasma, Mast, Myeloid), stromal (Endothelial cells, Pericytes, Fibroblasts, Smooth Muscle cells, Schwann cells), and epithelial (malignant in tumor and non-malignant in normal specimens) compartment per specimen.
(B) Number of cells per cluster (left) and fraction of cells from MMRd, MMRp, and normal specimens (right) within each cluster. Each specimen is indicated by a different color shade and separated by a vertical black line.
(C) NMF is underlying cell type clusters, tSNE visualization, and the gene expression programs.
(D) Gene expression programs can be further analyzed in the indicated ways to predict upstream regulators, infer function, or associate the program with clinical features. By calculating gene program activities in other scRNA-seq or bulk RNA-seq datasets, programs can be compared across studies. Clustering of covarying gene programs enables the prediction of multicellular interaction networks.
fig S2. The immune compartment in MMRd and MMRp CRC
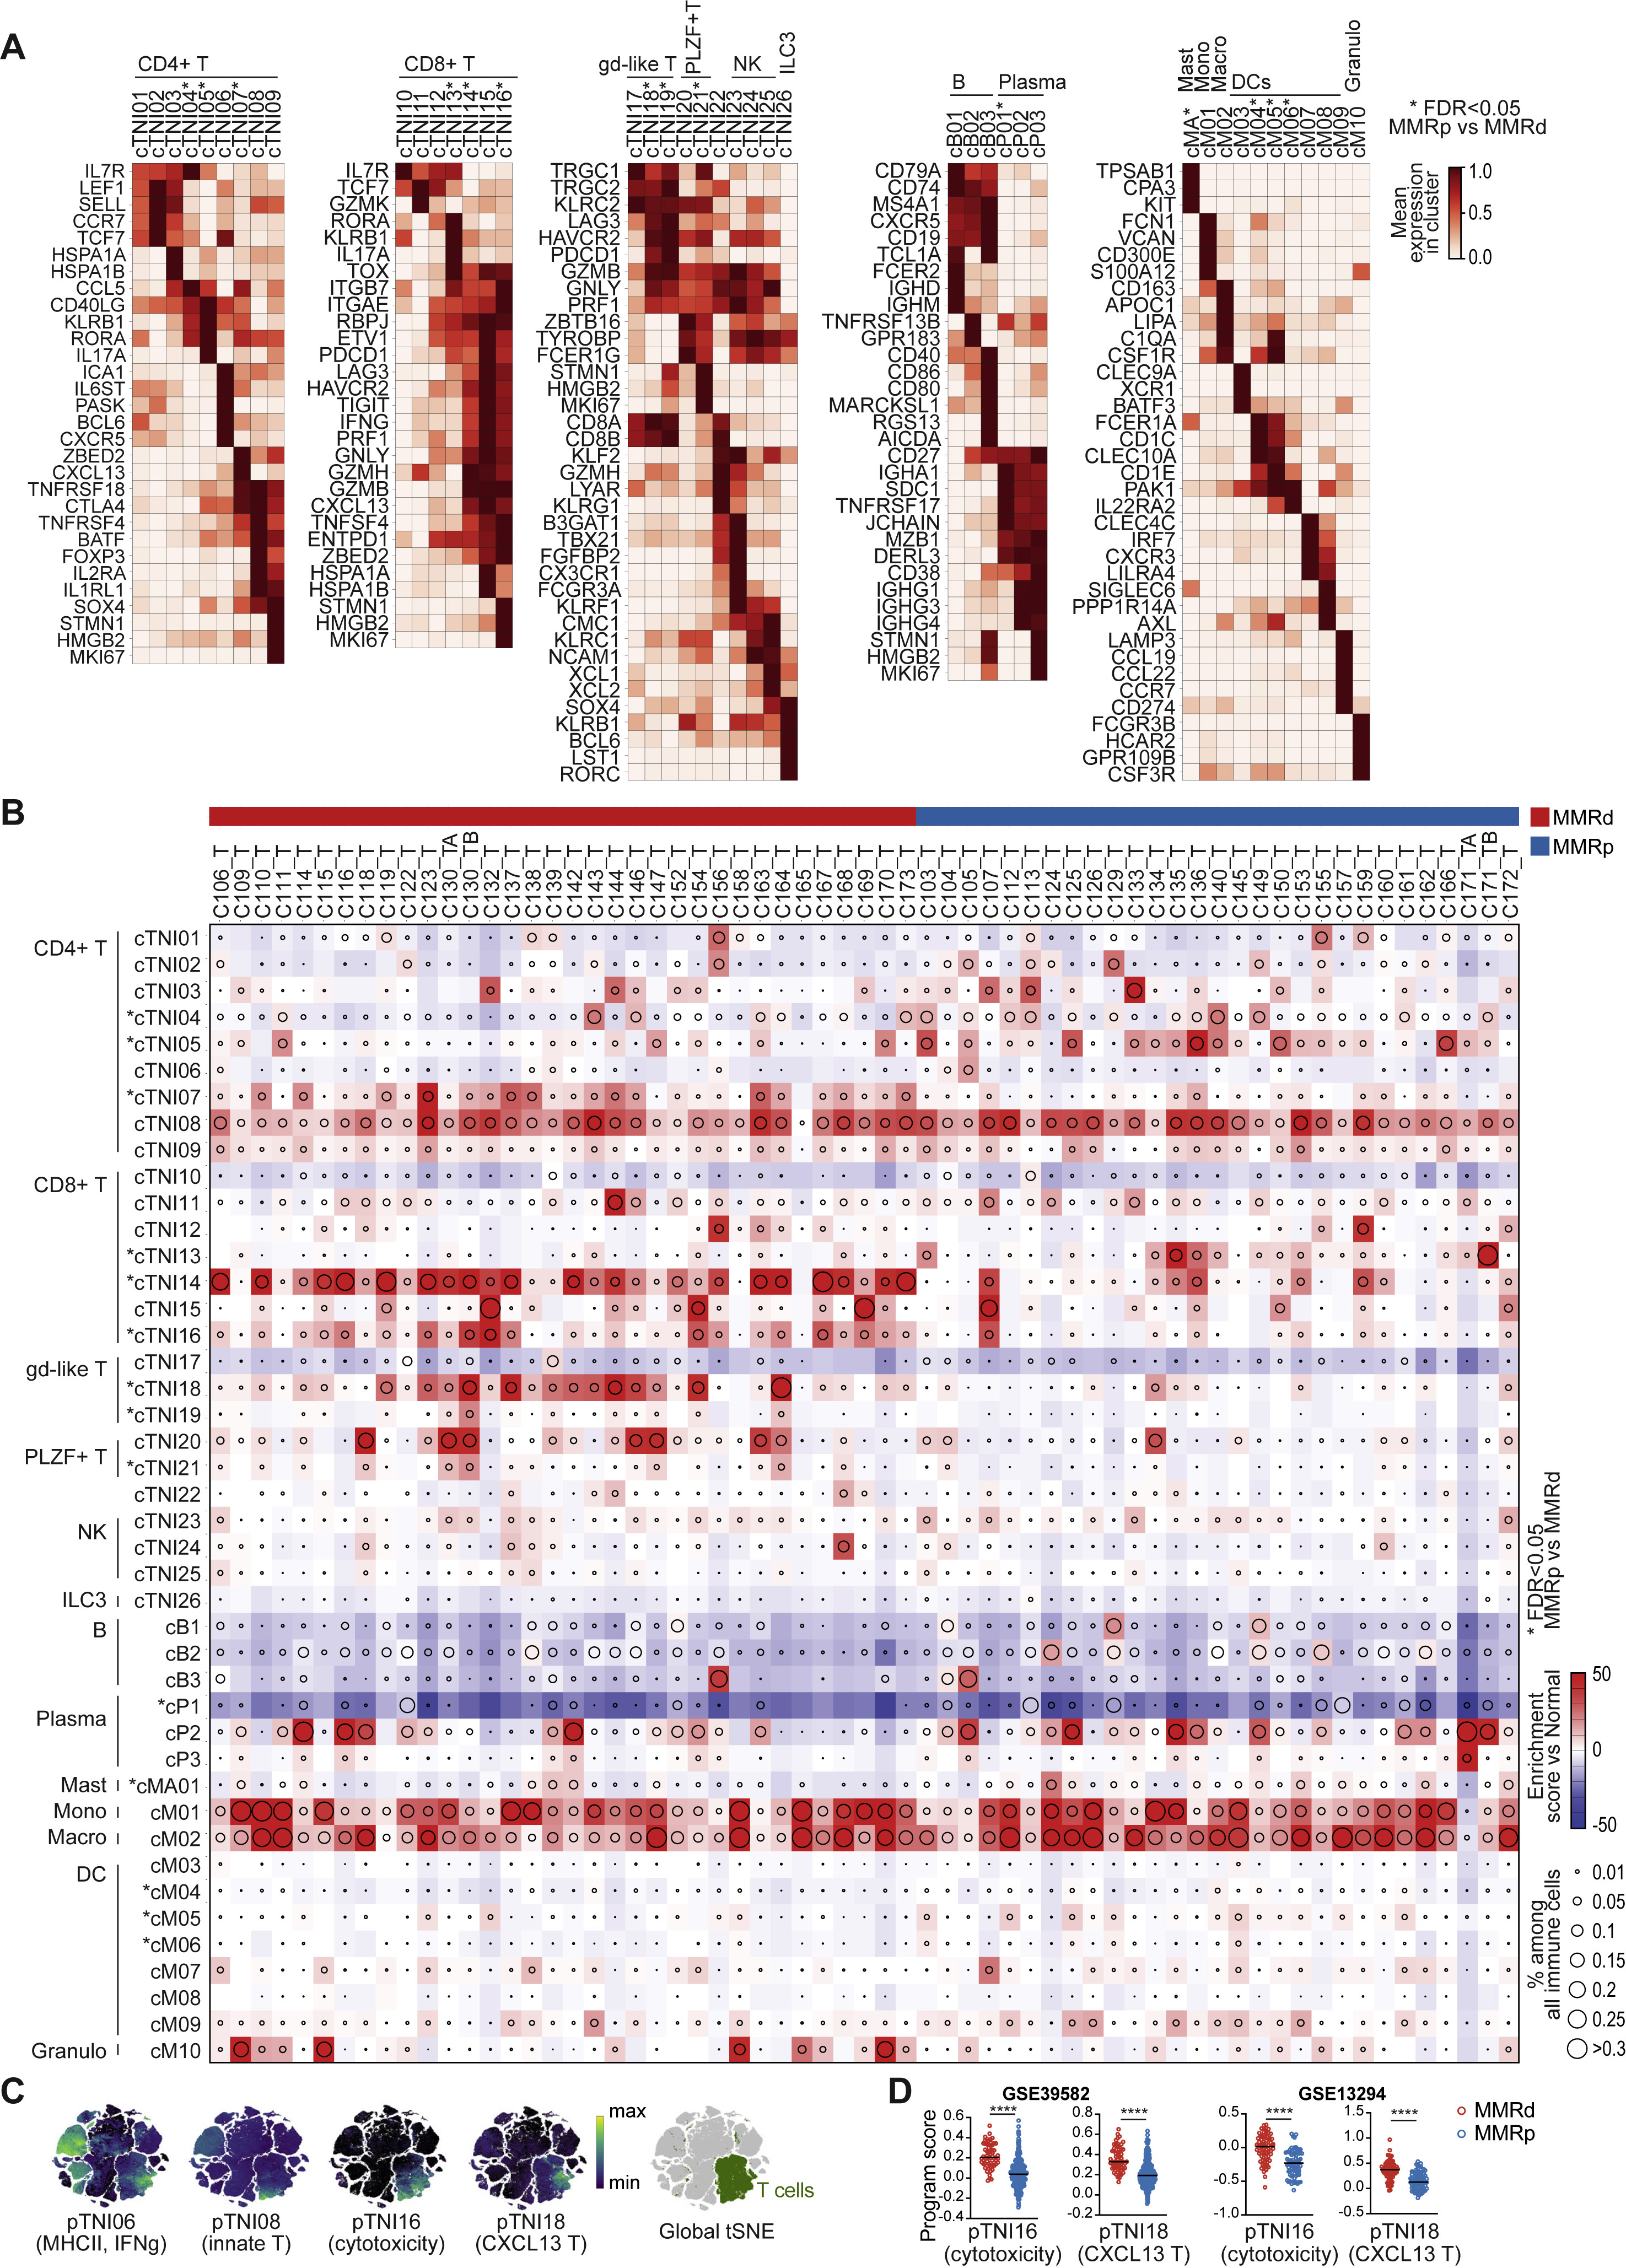
(A) Heatmaps showing selected unbiased and well-established marker genes for immune clusters as mean expression in normalized log2(TP10K+1). Clusters with differences in frequency between MMRp and MMRd tumors with Kruskal-Wallis false discovery rate (FDR) < 0.05 are marked with ∗. A comprehensive list of DEGs for each cluster can be found in Table S2.
(B) Changes in immune cell clusters in MMRp and MMRd tumors relative to adjacent normal tissue, showing frequency of immune cells (dot size) and enrichment/depletion (Pearson residual, colored squares). Clusters with differences in frequency between MMRp and MMRd tumors with Kruskal-Wallis false discovery rate (FDR) < 0.05 are marked with ∗.
(C) tSNEs showing pTNI06, pTNI08, pTNI16, and pTNI18 program activities on the global tSNE. The location of T cells is indicated in green (right).
(D) Gene signature score for pTNI16 and pTNI18 in MMRd and MMRp CRC in bulk RNA-seq from GSE39582 and GSE13294 patient specimens (Mann–Whitney–Wilcoxon test with ∗∗∗∗ for p≤0.0001, ∗∗∗ ≤0.001, ∗∗ ≤0.01, ∗ ≤0.05, ns for >0.05).
fig S3. Stromal remodeling in MMRd and MMRp CRC

(A) Heatmap showing selected literature based marker genes and differentially expressed genes for endothelial cell clusters as mean expression in normalized log2(TP10K+1). Clusters with differences in frequency between MMRp and MMRd tumors with Kruskal-Wallis false discovery rate (FDR) < 0.05 are marked with ∗. A comprehensive list of DEGs for each cluster can be found in Table S3.
(B) As (A) for pericyte clusters.
(C) As (A) for fibroblast clusters.
(D) Serial section of the same area as in Figures 3I and 3L stained by multiplex RNA ISH/IF for smooth muscle marker MYH11-ISH, fibroblast marker COL1A1/2-ISH, epithelial marker PanCK-IF, and endothelial marker VWF-ISH (left image). The MMP3+ CAFs surround VWF+ endothelial cells enclosing autofluorescent (AF) red blood cells. H&E image (right) with dilated blood vessels (bright pink, marked with arrows). Scale bars: 100um.
(E) Representative multiplex RNA ISH/IF image of patient C103 showing CXCL14-ISH expression by both epithelial lining fibroblasts and the malignant epithelial cells. Scale bar: 100um. tSNE shows CXCL14 expression in the malignant cells of patient C103 by scRNA-seq.
(F) Gene signature scores of cell type-specific DEGs for CXCL14+ CAFs, GREM1+ CAFs, MMP3+ CAFs, and all fibroblasts in MMRd and MMRp bulk RNA-seq of patient specimens in GSE39582 and GSE13294. Mann–Whitney–Wilcoxon test ∗∗∗∗ for p ≤ 0.0001, ∗∗∗ ≤ 0.001, ∗∗ ≤ 0.01, ∗ ≤ 0.05, ns for > 0.05.
(G) Representative multiplex RNA ISH/IF (as in D) image of MYH11+ COL1A/2-negative muscularis mucosa below the base of the crypt in non-neoplastic colon (left). H&E image (right) of the same region with arrow pointing to muscularis mucosa. Scale bars: 100μm.
Fig S4. The epithelial compartment in adjacent normal colon tissue and MMRd and MMRp CRC
(A) Epithelial programs with significantly differential activities between MMRd and MMRp tumors in the scRNA-seq dataset (GLME FDR < 0.05 and > 1.5-fold difference between means) scored in bulk RNA-seq from three external cohorts.
(B) Gene signature for the 43 epithelial programs in bulk RNA-seq from TCGA-CRC (COADREAD) patient specimens. Rows are ordered as in Figure 4B, columns are clustered. Significant MMRd versus MMRp differences are marked with ∗ (Wilcoxon, two-sided with family-wise error rate corrected p ≤ 0.05). Bar to the right of the heatmap shows the number of most closely correlated programs (≥90th percentile of correlations) based on program activities within scRNA-seq data (yellow+gray) and number of those most closely correlated programs that are preserved in TCGA (yellow).
(C) Heatmap shows selected unbiased and well-established marker genes for normal epithelial cell clusters. A comprehensive list of DEGs for each cluster can be found in Table S4.
(D) Transcriptional activities of epithelial programs within normal epithelial cell clusters.
(E) Similarity between epithelial gene programs and MMRd- and MMRp-derived gene programs based on cosine weight. Programs that only had close matches in MMRd are marked in red, programs that only had close matches in MMRp are marked in blue. See also Table S4.
Fig S5. Discovery of multicellular interaction networks in MMRp CRC
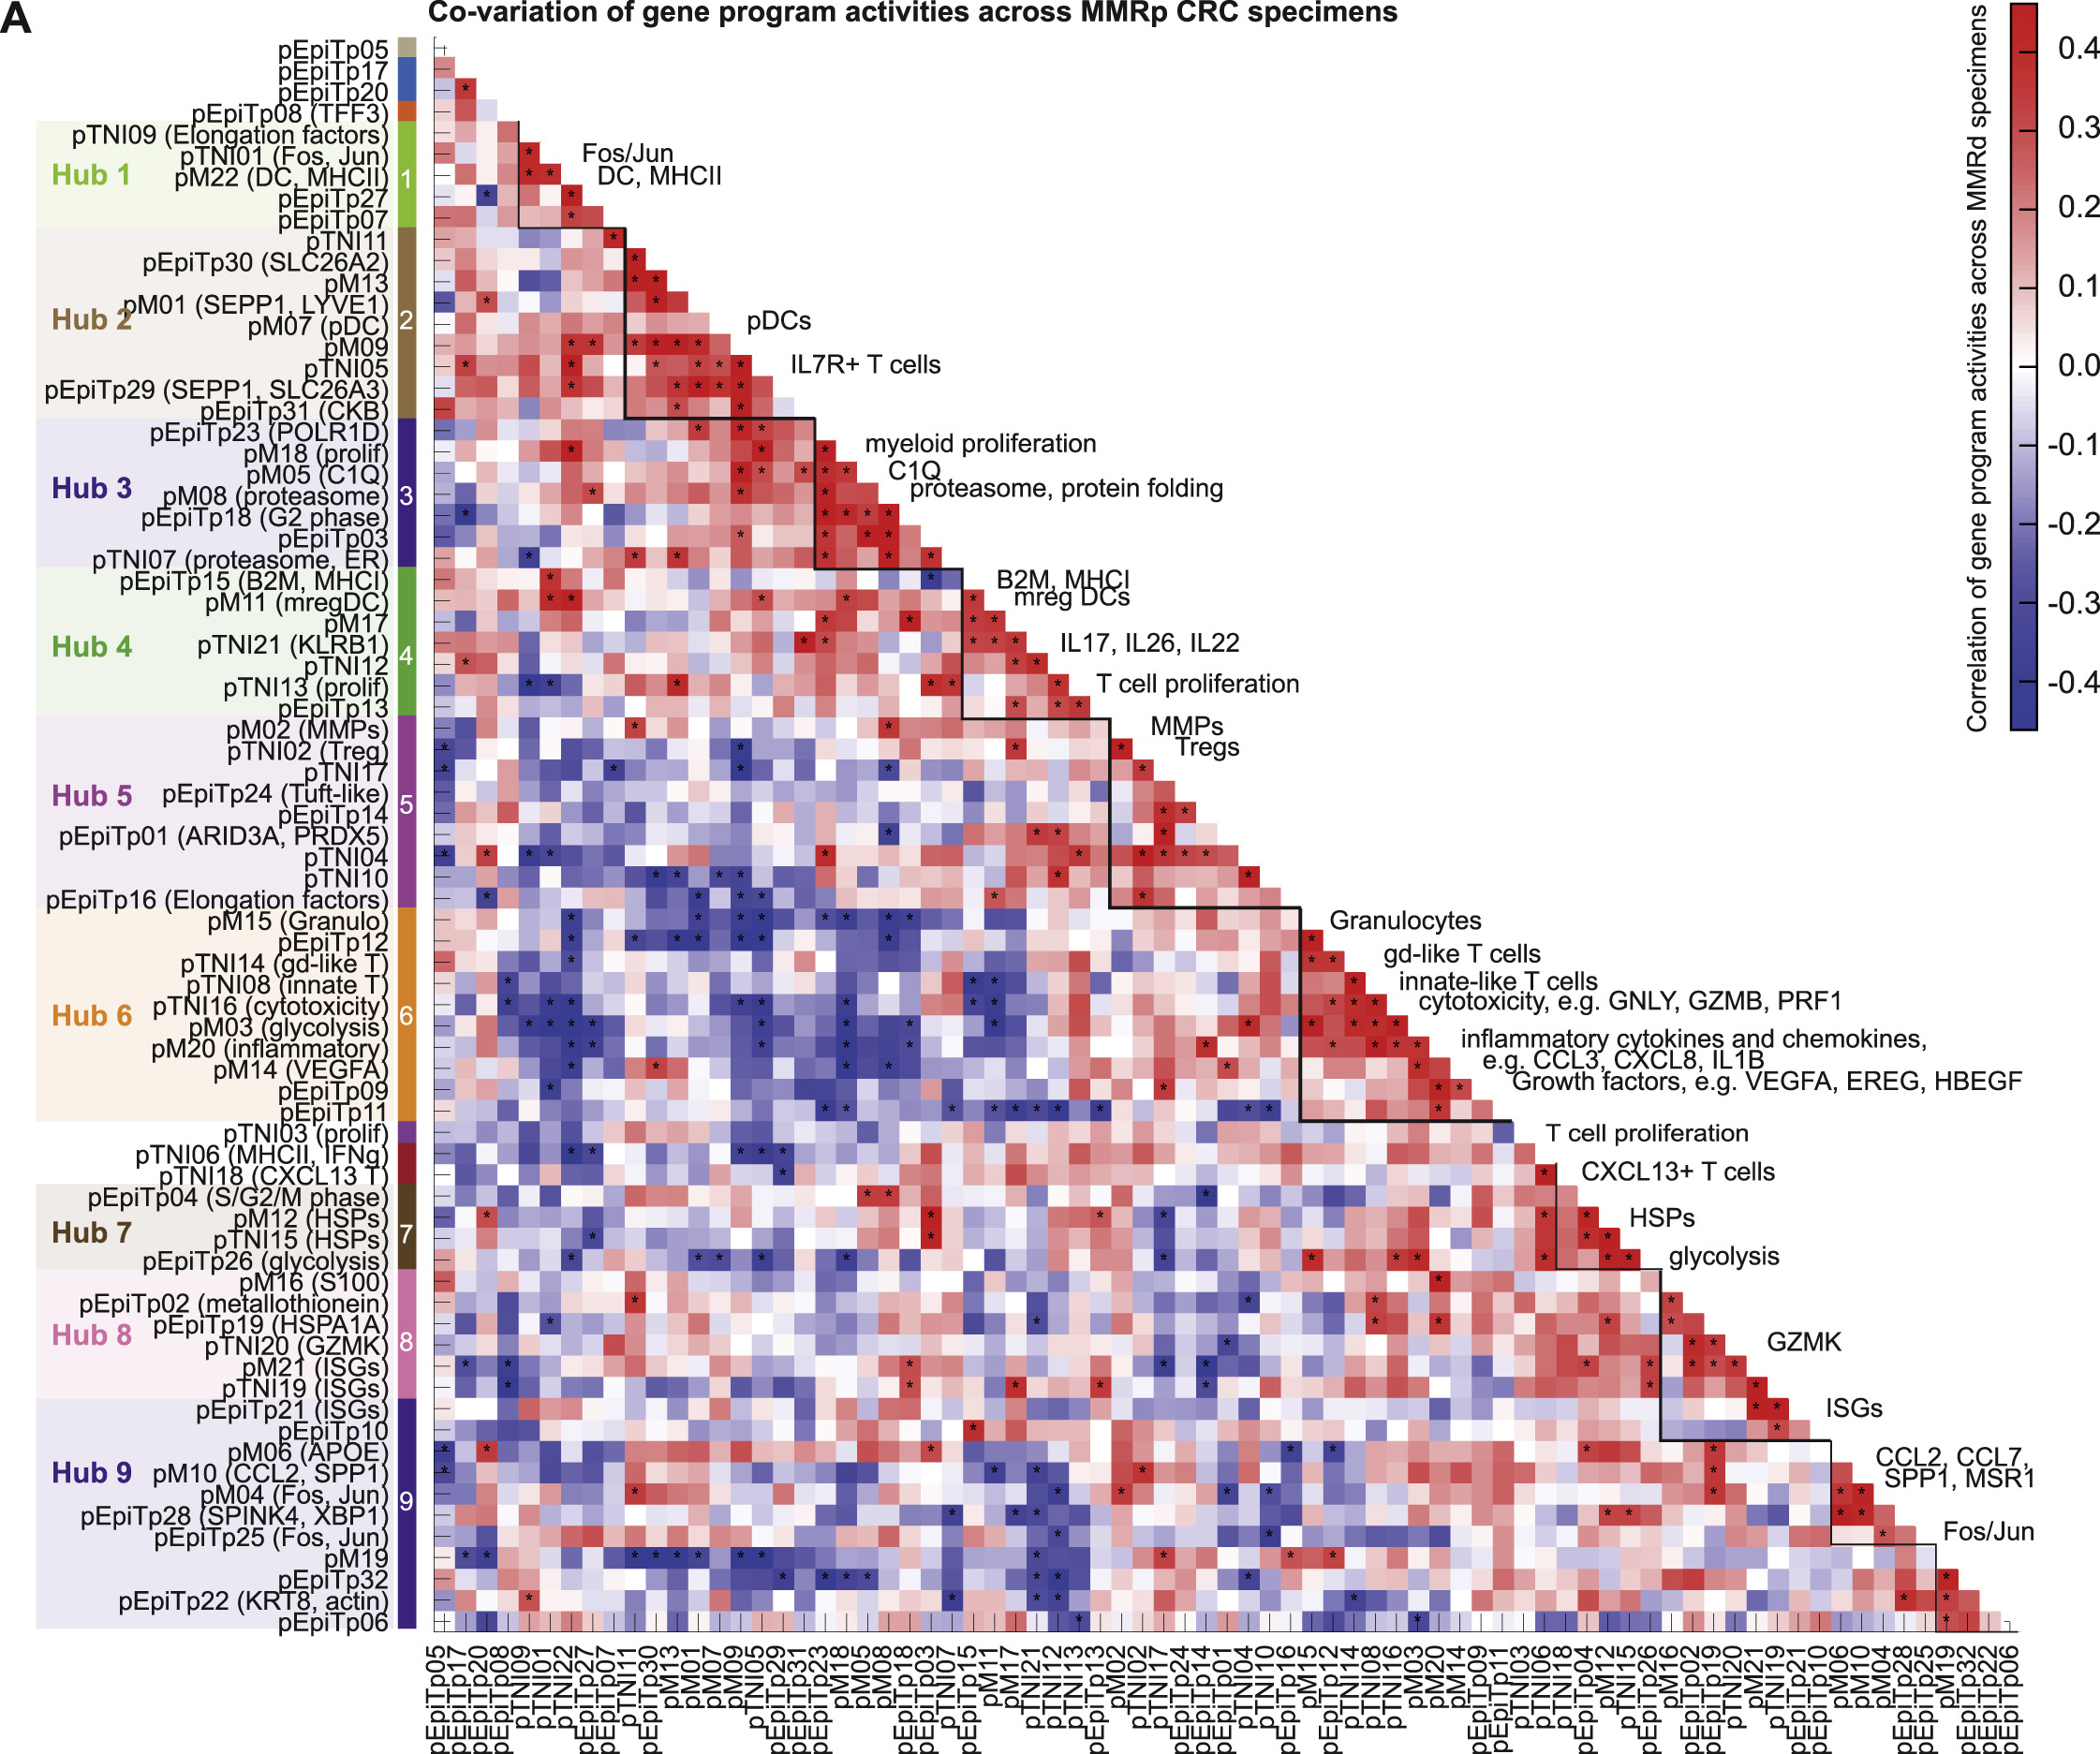
(A) Heatmap showing pairwise adjusted correlation of gene program activities (‘co-variation score’) across MMRp specimens (STAR Methods) using specimen-level activities in T/NK/ILC, myeloid, and malignant compartments. Significance is determined using permutation of patient IDs and is indicated with ∗ (FDR < 0.1). Densely connected modules (‘hubs’) are identified based on graph clustering of the significantly correlated edges.
Fig S6. An inflammatory hub at the luminal surface of primary MMRd and MMRp tumors
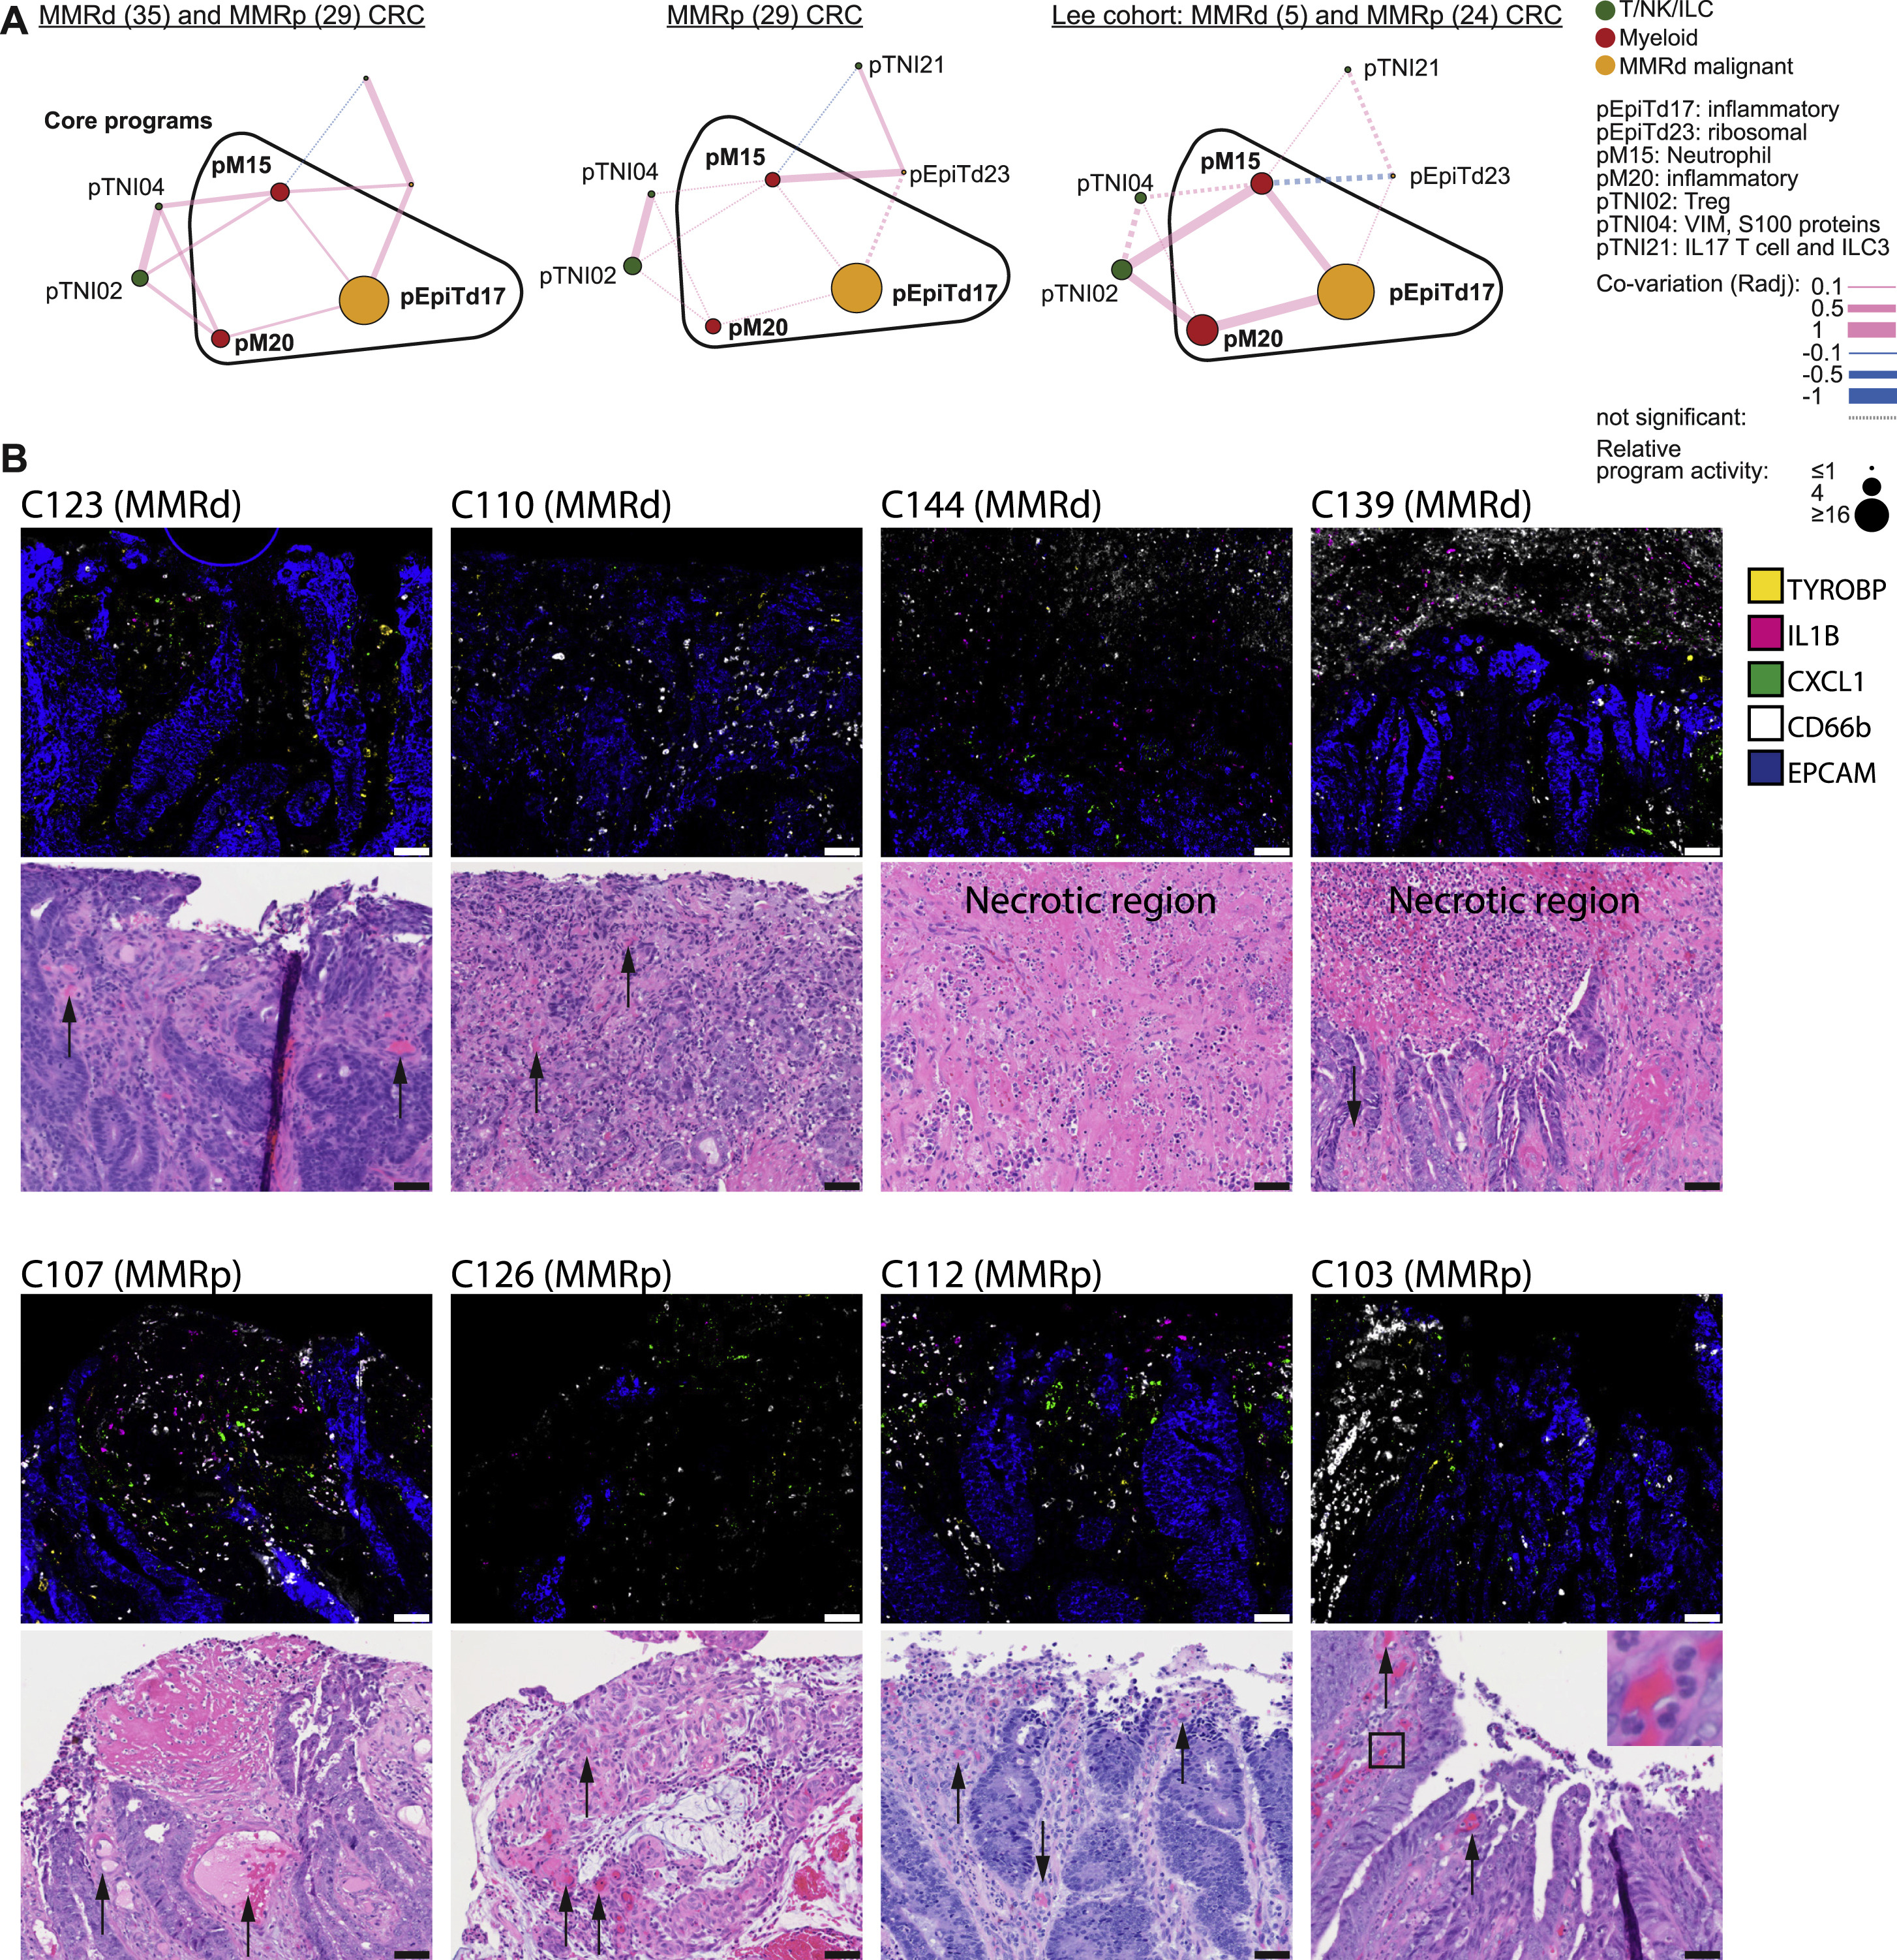
(A) Inflammatory hub 3, as discovered in MMRd, projected onto all MMRd and MMRp specimens from our scRNA-seq cohort (left; n = 35 MMRd, n = 29 MMRp), MMRp specimens (middle) or (Lee et al., 2020) (right; n = 5 MMRd, n = 24 MMRp). Nodes respresent gene programs and the size of each node is proportional to the log ratio of the respective mean program activity in MMRd or MMRp versus normal. Edge thickness is proportional to co-variation scores. Pink lines depict positive, blue lines negative correlations. Non-significant edges are depicted as dotted lines.
(B) Multiplex RNA ISH/IF staining for neutrophil marker CD66b-IF, epithelial marker EPCAM-ISH, myeloid TYROBP-ISH, IL1B-ISH, and CXCL1-ISH and corresponding H&E images. Representative images of indicated CRC specimens (n = 4 MMRd, n = 4 MMRp) showing accumulations of neutrophils, IL1B and CXCL1 signals at the malignant interface with the colonic lumen, often nearby dilated vessels (marked with arrows) or in necrotic regions (as indicated). Note also that neutrophils are sometimes observed directly within vessels (e.g., C103, inset). Scale bars: 50μm.
fig S7. A coordinated network of CXCL13+ T, myeloid, and malignant cells expressing ISGs
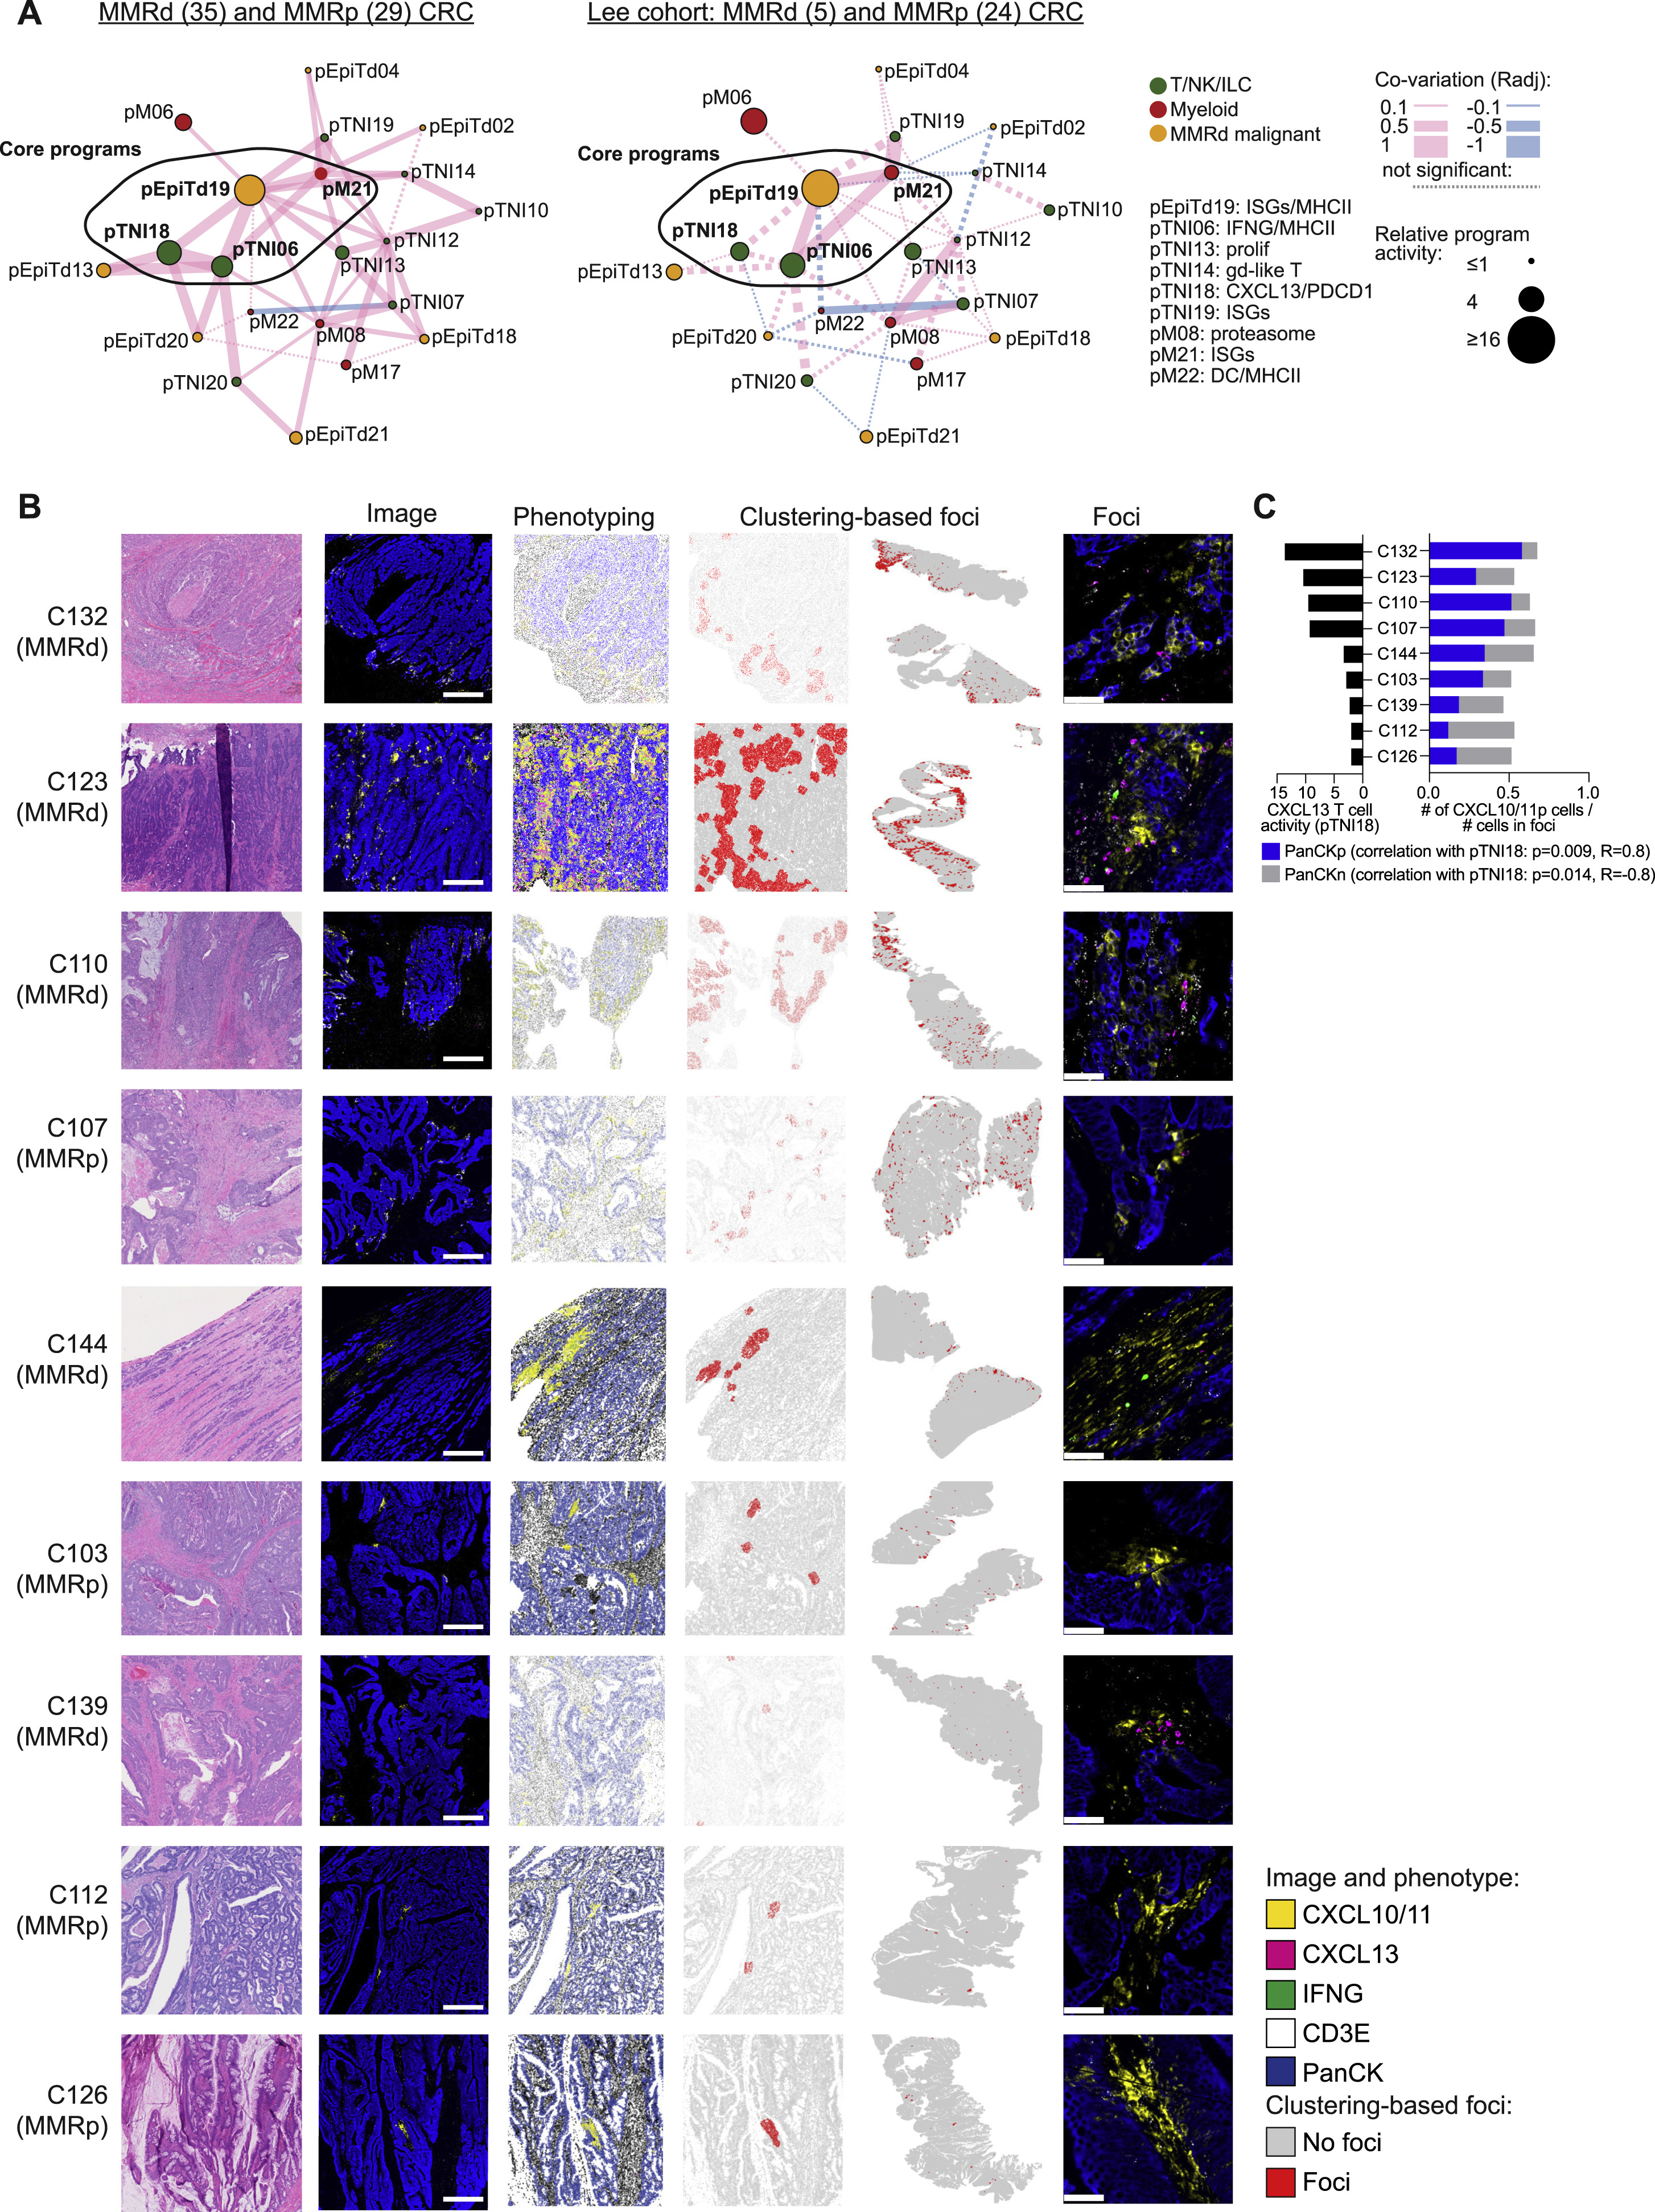
(A) ISG/CXCL13 hub, as discovered in MMRd, projected onto all MMRd and MMRp specimens from our scRNA-seq cohort (left; n = 35 MMRd, n = 29 MMRp) or Lee et al. (2020) (right; n = 5 MMRd, n = 24 MMRp). Nodes respresent gene programs and the size of each node is proportional to the log ratio of the respective mean program activity in MMRd or MMRp versus normal. Edge thickness is proportional to co-variation scores. Pink lines depict positive, blue lines negative correlations. Non-significant edges are depicted as dotted lines.
(B) Multiplex RNA ISH/IF staining for epithelial marker PanCK-IF, T cell marker CD3E-ISH, CXCL10/CXCL11-ISH, CXCL13-ISH, and IFNG-ISH on 9 different patient sections (MMRd n = 5: C110, C123, C132, C139, C144; MMRp n = 4: C103, C112, C126, C107). Cells were phenotyped using Halo software and clustered by their neighborhoods (defined as 100 μm) into cells that are part of the foci or not (red and gray, respectively). Shown from left to right for each patient specimen are an H&E section, fluorescent image, a computational rendering of the same section, the assignment to foci in the same section, the assignment of foci in the whole slide scan and magnified fluorescent images of foci. Scale bars: 500 μm for second column, 50 μm for rightmost column.
(C) For each specimen (ordered by their scRNA-seq-based CXCL13 T cell activity) the fractions of CXCL10/CXCL11-positive PanCK-positive and CXCL10/CXCL11-positive PanCK-negative cells within foci are shown. High CXCL13 T cell activity correlates with higher fractions of CXCL10/CXCL11-positive PanCK-positive cells (Spearman correlation).
Ref: