

Abstract
Glia have been implicated in Alzheimer’s disease (AD) pathogenesis. Variants of the microglia receptor triggering receptor expressed on myeloid cells 2 (TREM2) increase AD risk, and activation of disease-associated microglia (DAM) is dependent on TREM2 in mouse models of AD. We surveyed gene-expression changes associated with AD pathology and TREM2 in 5XFAD mice and in human AD by single-nucleus RNA sequencing. We confirmed the presence of Trem2-dependent DAM and identified a previously undiscovered Serpina3n+C4b+ reactive oligodendrocyte population in mice. Interestingly, remarkably different glial phenotypes were evident in human AD. Microglia signature was reminiscent of IRF8-driven reactive microglia in peripheral-nerve injury. Oligodendrocyte signatures suggested impaired axonal myelination and metabolic adaptation to neuronal degeneration. Astrocyte profiles indicated weakened metabolic coordination with neurons. Notably, the reactive phenotype of microglia was less evident in TREM2-R47H and TREM2-R62H carriers than in non-carriers, demonstrating a TREM2 requirement in both mouse and human AD, despite the marked species-specific differences.
Methods
Processing data with Seurat package and quality control
The Seurat package in R was used for subsequent analysis.
For quality control, nuclei with mitochondrial content >5% were removed. Nuclei that are duplets or multiplets were filtered out by two steps.
- First, nuclei with more than one marker gene expressed were removed.
- Then cells with high UMI and gene number per cell were filtered out.
- Cutoffs for UMI and gene number were determined on the basis of histograms showing cell density as a function of UMI per gene counts.
- For 7-month-old mouse brain snRNA-seq analysis, a cutoff of 300–9,000 UMI and 300–5,600 genes was applied. After filtering, a total of 73,419 individual nuclei across all genotypes remained, with a median of 3,941 UMIs and 2,378 genes per nucleus for downstream analysis.
- For human brain snRNA-seq, a cutoff of 400–20,000 UMI and 400–7,000 genes was applied. After filtering, 66,311 nuclei were remained across 11 AD (CV), 10 AD (R62H) and 11 control samples, with a median of 1,951 UMIs and 1,312 genes per nucleus for downstream analysis.
- For 15-month-old mouse brain snRNA-seq analysis, genes expressed in fewer than 3 nuclei and nuclei that expressed <400 or >3,500 genes were removed for downstream analysis. After filtering, 38,230 nuclei were remained.
Data were normalized using a scaling factor of 10,000, and nUMI was regressed with a negative binomial model. Principal component analysis was performed using the top 3,000 most variable genes and t-SNE analysis was performed with the top 20 PCAs. Clustering was performed using a resolution of 0.6.
Clustering and finding markers
Principal component analysis was performed prior to clustering and the first ten principal components were used based on the ElbowPlot. Clustering was performed using the FindClusters function, which works on K-nearest neighbor (KNN) graph model with the granularity ranging from 0.1–0.9 and selected 0.2 for the downstream clustering. For identifying the markers for each cluster, we performed differential expression of each cluster against all other clusters, identifying negative and positive markers for that cluster. Nuclei from broad cell types (astrocytes, microglia and oligodendrocytes clusters) were taken and re-clustered to further analyze the sub-clusters in each cell type.
Analysis of gene differential expression
Differential expression of genes between conditions was done using the MAST algorithm of the Seurat package in R, which implements a two-part hurdle model. log2(fold change) of average expression and the percentage of cells (pct) expressing the genes in each condition were generated.
For the mouse snRNA-seq analyses, to facilitate data interpretation, changes in the frequency of cells were taken into account. The bulk fold change was calculated by adding log2(pct1 + 0.005) / (pct2 + 0.005) to the log2(fold change) generated from the Seurat Package. The adjusted P value was calculated using Bonferroni correction.
Lists of mouse DEGs were generated by filtering all genes for fold change > 1.5, adjusted P < 0.05. The lists were ordered by adjusted P value. For the human snRNA-seq analysis, lists of DEGs in non-neuronal clusters were generated by filtering genes for log2(fold change) > 0.5, P < 0.05. These gene lists were used as inputs for downstream sub-clustering analyses. Lists of human DEGs in neuronal clusters were generated by filtering all genes for P < 0.05. The lists were ordered by fold change.
Comparing marker genes with public datasets
Public datasets GSE53890 and GSE39420 were processed and analyzed in the Phantasus tool (https://artyomovlab.wustl.edu/phantasus/). The top 12,000 genes ranked by average gene expression were selected for differential-expression analysis using the LIMMA package. Differential expression was calculated between samples with age less than 40 and greater than 80, and between controls and people with early-onset AD, respectively.
Gene-set enrichment analysis was then performed using the marker genes from oligodendrocyte and microglia sub-clusters as inputs.
Figure
Fig. 1: snRNA-seq distinguishes major brain-cell types and shows microgliosis in the 5XFAD brains.
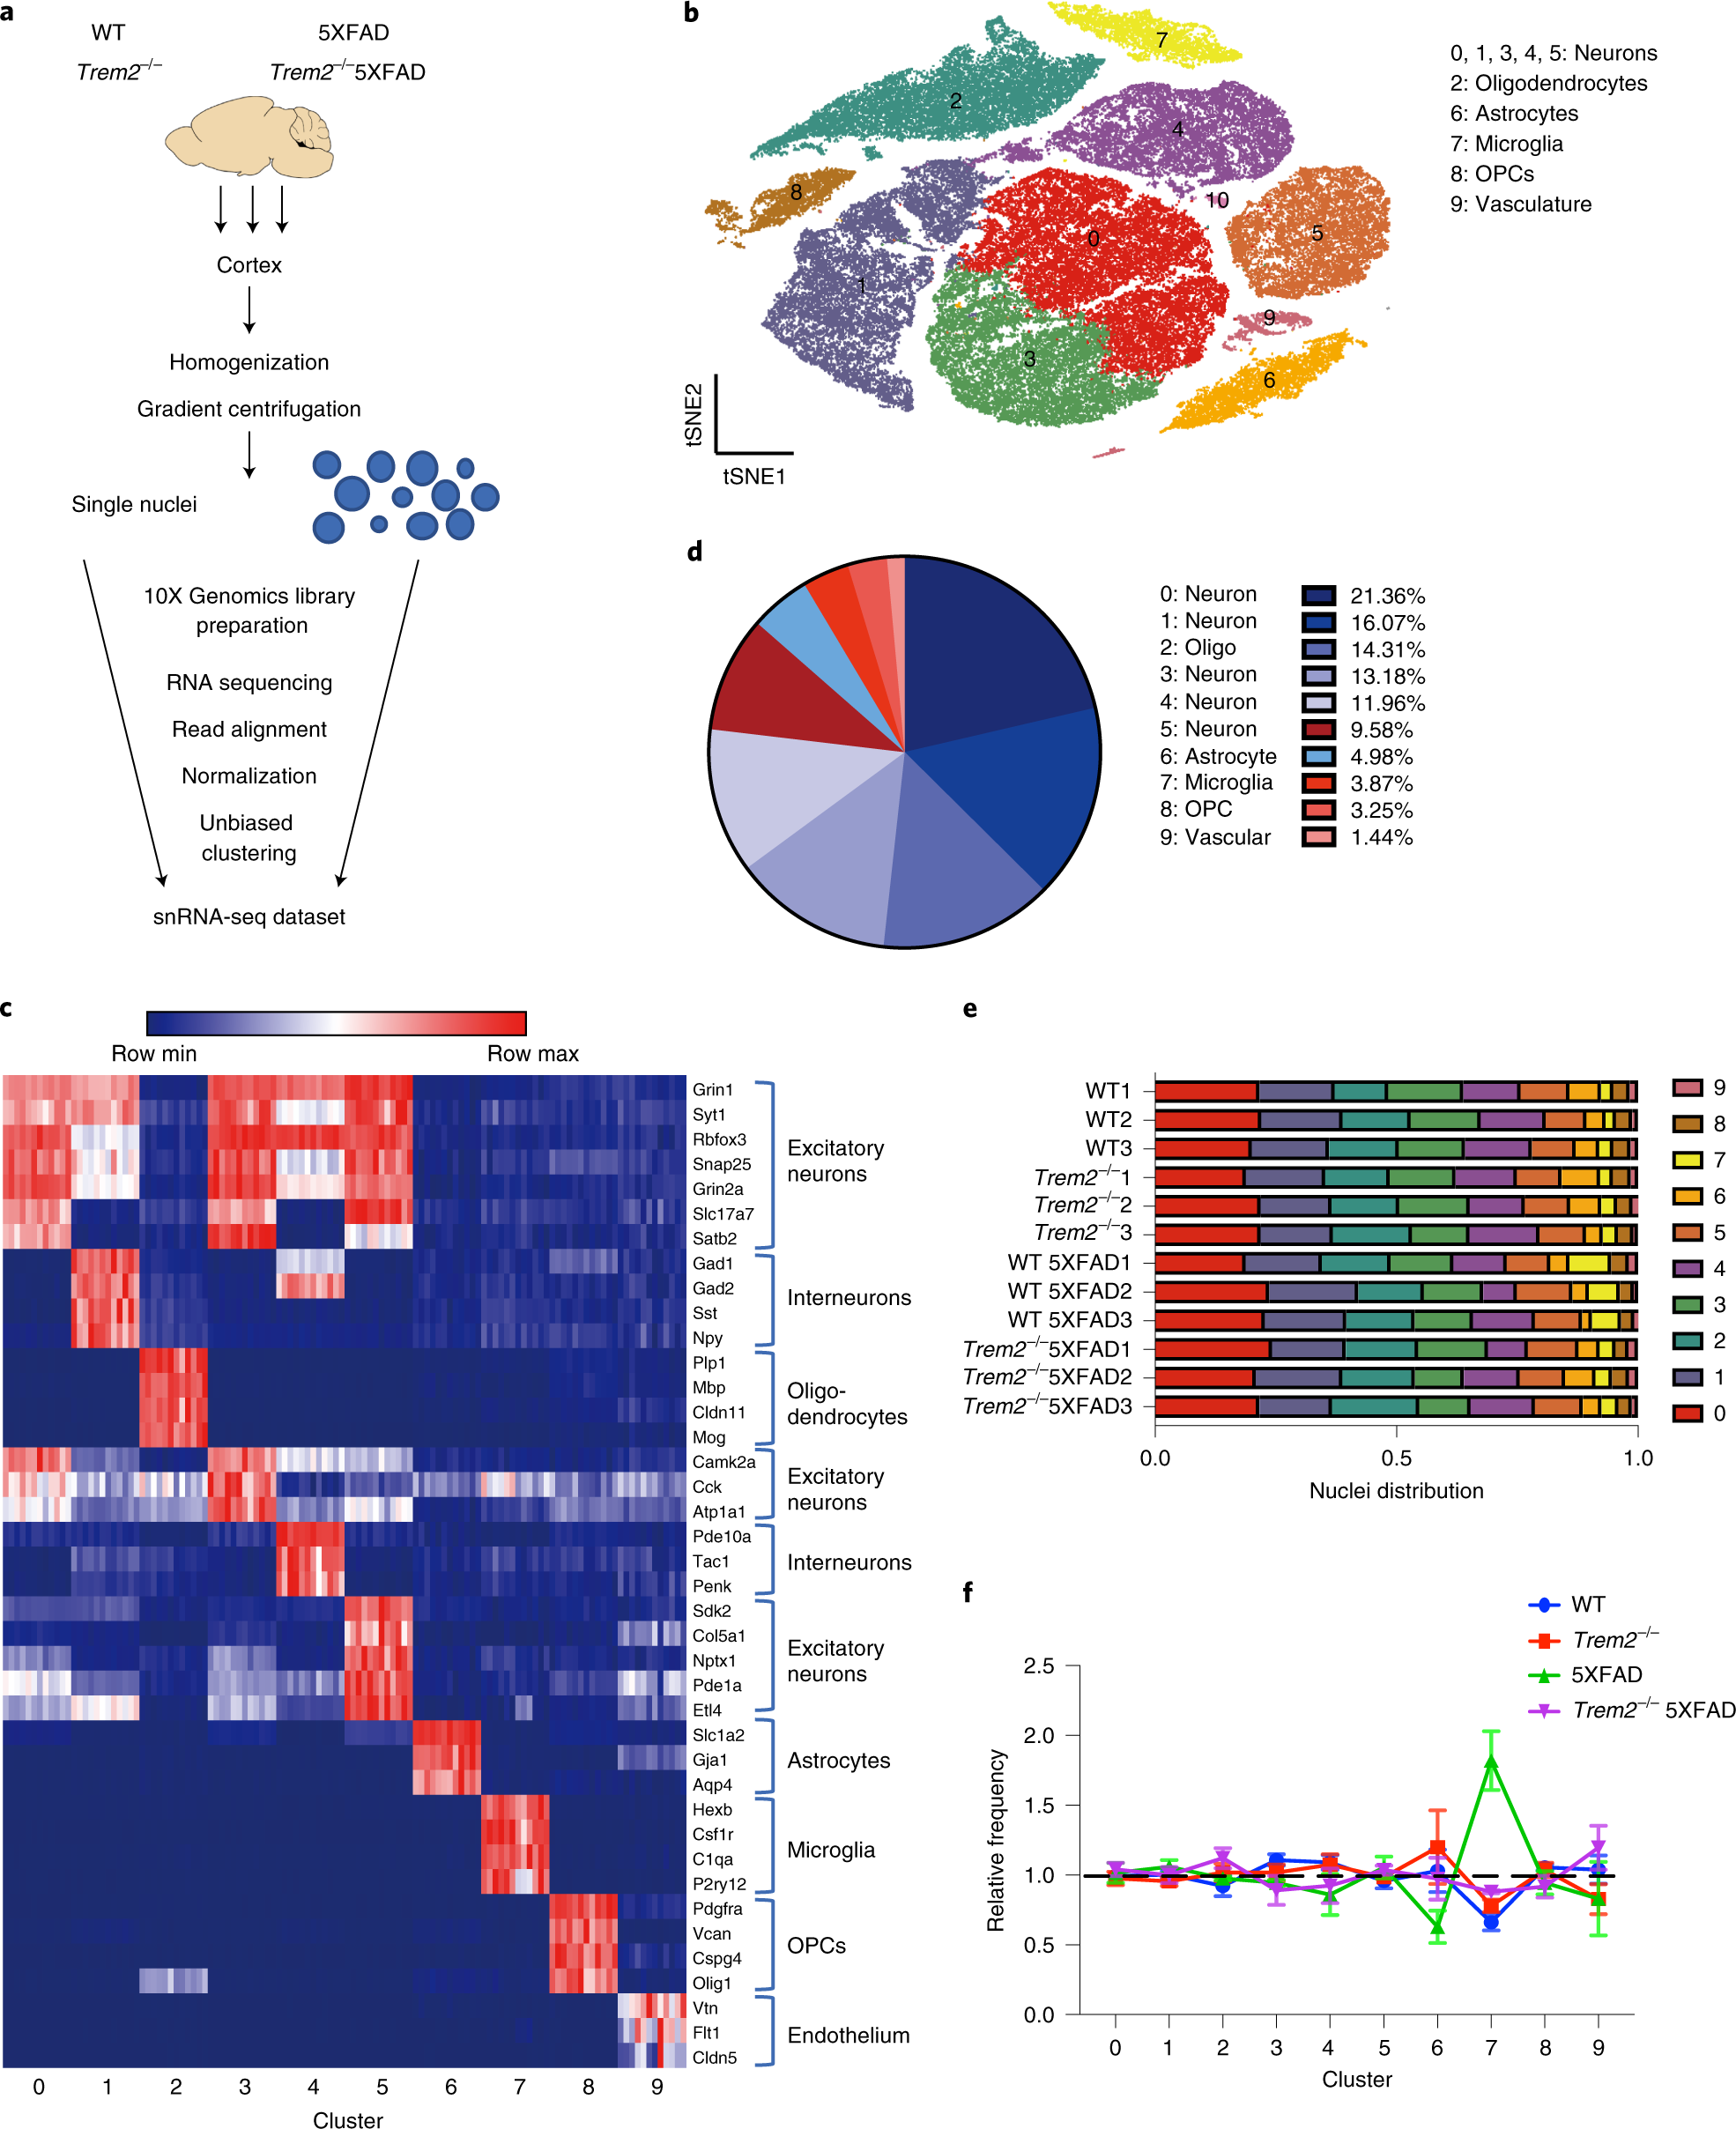
a, Diagram of snRNA-seq pipeline. b, t-SNE plot showing 11 distinguished clusters, 0–10, with cell-type identities as determined by expression of specific markers (Extended Data Fig. 1b). Cluster 10 had very low frequency and did not have a clear marker profile and was thus omitted from analysis. n = 3 biologically independent mouse brain samples per genotype; 73,419 total nuclei. c, Heat map showing expression of specific markers in every sample, identifying each cluster in b. Each column represents one individual mouse. Within each cluster (0–9, below plot), mice from left to right: WT1–3, Trem2**–/–1–3, WT 5XFAD1–3, Trem2**–/– 5XFAD1–3. Clusters are identified with the same markers in every mouse. d, Pie chart showing the frequency of each cluster across all genotypes. e, Bar graph showing the frequency of each cluster in every sample. All clusters are similarly represented among the 3 mice analyzed for each genotype. f, Relative frequency of clusters in each genotype, normalized to overall frequency in d. Cluster 7 (microglia) was highly enriched in 5XFAD. n = 3 biologically independent mouse brain samples per genotype. Data are presented as mean ± s.e.m.
Fig. 2: Characterization of the microglia cluster.

a, t-SNE plot showing the microglia cluster (cluster 7) from Fig. 1 expressing microglia genes, such as C1qa, Fcrls and Tyrobp. n = 3 biologically independent mouse brain samples per genotype; 73,419 total nuclei. b, Volcano plots showing significant DEGs (fold change > 1.5, two-part hurdle model, adjusted P < 0.05, Bonferroni correction) in microglia of 5XFAD versus WT (effect of Aβ) and 5XFAD versus Trem2**–/– 5XFAD (dependence of Trem2). Microglia nuclei show an Aβ- and Trem2-dependent DAM signature. n = 3 biologically independent mouse brain samples per genotype; 524 WT, 1,123 WT 5XFAD and 604 Trem2**–/– 5XFAD microglial nuclei. c, Heat map showing the average gene expression of top DEGs in the microglia cluster for each sample. DAM signature is present in all 5XFAD mice in a Trem2-dependent manner. Color scheme shows row max and row min, which represents relative expression of each gene among all samples. d, The log2(fold change) values of top DEGs in 7-month-old 5XFAD versus WT mice and 15-month-old 5XFAD versus WT mice are plotted against each other. DAM signature is consistently present in both 7- and 15-month-old mice. e, t-SNE plot of re-clustered microglia (from Cluster 7) identifying 4 sub-clusters. n = 3 biologically independent mouse brain samples per genotype; 2,840 total microglial nuclei. f, Bar graph showing the frequency of each microglia sub-cluster in all genotypes. Sub-cluster 1 is only present in 5XFAD samples, mostly in the WT 5XFAD mice and to a lesser extent in the Trem2**–/– 5XFAD. g, Violin plots showing the expression of DAM genes, Cst7, Lpl and Csf1, in microglia sub-clusters. DAM genes are enriched in sub-cluster 1. Violin plots are presented with floating boxes showing median (middle line) and quartiles (top and bottom). Minima and maxima are shown as the bottom and top of the violin plots. n = 3 biologically independent mouse brain samples per genotype; 524 WT, 582 Trem2**–/–, 1,123 WT 5XFAD and 604 Trem2**–/– 5XFAD microglial nuclei.
Fig. 3: Identification of a novel oligodendrocyte Aβ-reactive state defined by C4b and Serpina3n expression.

a,b, Volcano plots showing DEGs (fold change > 1.5, two-part hurdle model, adjusted P < 0.05, Bonferroni correction) of 5XFAD versus WT in 7-month-old (a) and 15-month-old (b) mice in the oligodendrocyte cluster. Each panel is accompanied by a t-SNE plot, showing the oligodendrocyte cluster in the two cohorts of mice. C4b, Serpina3n and H2-D1 were significantly upregulated in 5XFAD mice at both 7 and 15 months of age. n = 3 biologically independent mouse brain samples per genotype; 2,672 WT and 2,180 WT 5XFAD oligodendrocytes (a). n = 617 WT and 160 WT 5XFAD oligodendrocytes pooled from 3 mouse brains per genotype (b). c, Quantification of total number of Olig2+ nuclei in the four genotypes. n = 3 biologically independent mice per genotype. P value by one-way analysis of variance (ANOVA) with Tukey’s multiple-comparisons test. d,f, Representative IF images of C4b (d) and Serpina3n (f) staining in 15-month-old cortices of all genotypes showing perinuclear localization of C4b and Serpina3n around Olig2+ nuclei in 5XFAD brains. X04, methoxy X04, indicative of plaques. n = 3 biologically independent mice per genotype. Scale bars, 40 μm. e,g, Automated quantification of staining intensity was performed by averaging the voxel intensities of C4b (e) and Serpina3n (g) staining within 2 μm of (oligodendrocyte) or more than 5 μm away (other) from Olig2+ objects in d and f. n = 3 biologically independent mice per genotype. P value by two-way ANOVA with Tukey’s multiple-comparisons test. h, Representative IF images of 5-month-old WT 5XFAD and Trem2**–/– 5XFAD cortices showing Serpina3n+ oligodendrocytes are present solely in plaque-bearing regions. IV, V and VI indicate corresponding cortical layers. cg, cingulum. X04, methoxy X04, indicative of plaques. n = 6 biologically independent mice per genotype. Scale bar, 60 μm. i, Quantification of the density of Serpina3n+ and Serpina3n– oligodendrocytes in shells away from plaques. Serpina3n+ but not Serpina3n– oligodendrocytes are mostly found in regions bearing plaques. n = 6 biologically independent mice per genotype. All data are presented as mean ± s.e.m. (c,e,g,i).
Fig. 4: Human AD brain exhibits a microglia signature distinct from that in mice.

a, t-SNE plot showing 10 clusters from 11 people with AD carrying TREM2-CV, 10 carrying TREM2-R62H and 11 non-AD controls. n = 66,311 total nuclei. b, Bar graph presenting the frequency of each cluster in every group. c, Heat maps showing fold change of top DEGs (log2(fold change) > 0.5, two-part hurdle model, adjusted P < 0.05, Bonferroni correction) in microglia, comparing AD (CV) versus control. Left, genes upregulated in AD. Right, genes downregulated in AD. n = 11 AD (CV), 919 nuclei; 11 controls, 1,547 nuclei. d, Gene ontology terms associated with genes upregulated (left) and downregulated (right) genes in AD. n = 45 upregulated and 47 downregulated genes, hypergeometric test. e, Representative IF images of AD and control cortical samples showing nuclear IRF8 staining within Iba1+ microglia in AD. Scale bar, 5 μm. The experiment was performed twice. f, Representative IHC from AD cortical autoptic samples and age-matched controls showing that microglia upregulate Iba1, CD68 and HLA-DR in AD. Insets show higher magnification of the corresponding panels. Lower inset in Iba1 AD panel shows double staining of Iba1+ microglia in blue surrounding silver+ plaques. Scale bars, 100 μm (panels); 30 μm (insets). The experiment was performed six times. g,h, P2RY12 level in mouse microglia-like cultures is increased upon Irf8 overexpression (OE) (g) and decreased in Irf8**–/– cultures (h), compared with WT cultures. Data are from two (g) or three (h) independent experiments. Numbers indicate cell frequency in each quadrant. i, t-SNE plots of re-clustered microglia showing 7 sub-clusters. Micro0 is increased in AD; Micro1 is reduced. n = 919 AD and 1,547 control microglial nuclei. j, t-SNE plots showing average z-scores of DEGs in microglia. Top, upregulated genes are enriched in Micro0. Bottom, downregulated genes are enriched in Micro1. n = 46 upregulated and 47 downregulated genes in microglia listed in Supplementary Table 4 were used as inputs.
Fig. 5: snRNA-seq identifies human AD-associated astrocyte and oligodendrocyte signatures corroborated by NanoString gene-expression analysis.

a, t-SNE plots of re-clustered astrocytes showing six sub-clusters in AD and controls. Astro3 is depleted in AD. Astro4 is present in only one sample and is omitted for downstream analysis. n = 2,641 AD and 2,955 control astrocytes. b, t-SNE plots showing average z-scores of DEGs in astrocytes. Top, upregulated genes are enriched in Astro0 and Astro1. Bottom, downregulated genes are enriched in Astro3. n = 13 upregulated and 65 downregulated astrocyte genes listed in Supplementary Table 4 were used as inputs. c, Heatmap representing average gene expression of top DEGs in astrocyte sub-clusters in AD versus controls. Color scheme shows row max and row min. d, Heatmap showing average gene expression of top DEGs in oligodendrocyte clusters (Oli0 and Oli1) in each sample. Color scheme shows row max and row min. e, t-SNE plots of re-clustered oligodendrocytes showing five sub-clusters in AD and controls. Oligo3 is enriched, whereas Oligo1 and Oligo2 are significantly reduced in AD. n = 6,980 AD and 16,499 control oligodendrocytes. f, Heatmap representing the average gene expression of top oligodendrocyte DEGs in oligodendrocyte sub-clusters in AD versus control. Color scheme shows row max and row min. g, t-SNE plots showing expression of SERPINA3 and C4B in human astrocytes. n = 66,311 total nuclei. h, Volcano plot showing DEGs of AD versus control from Rush samples analyzed by NanoString. n = 13 subjects with AD and 12 controls. P value was determined by multivariate linear regression with Benjamini–Yekutieli adjustment. i, Heatmaps depicting fold changes in each cluster in snRNA-seq of selected DEGs from NanoString. Direction of change of these genes is consistent between snRNA-seq and NanoString. Numbers represent log2(fold change). Red, upregulation. Blue, downregulation.
Fig. 6: TREM2-R62H and TREM2-R47H carriers exhibit reduced microglia reactive signature.
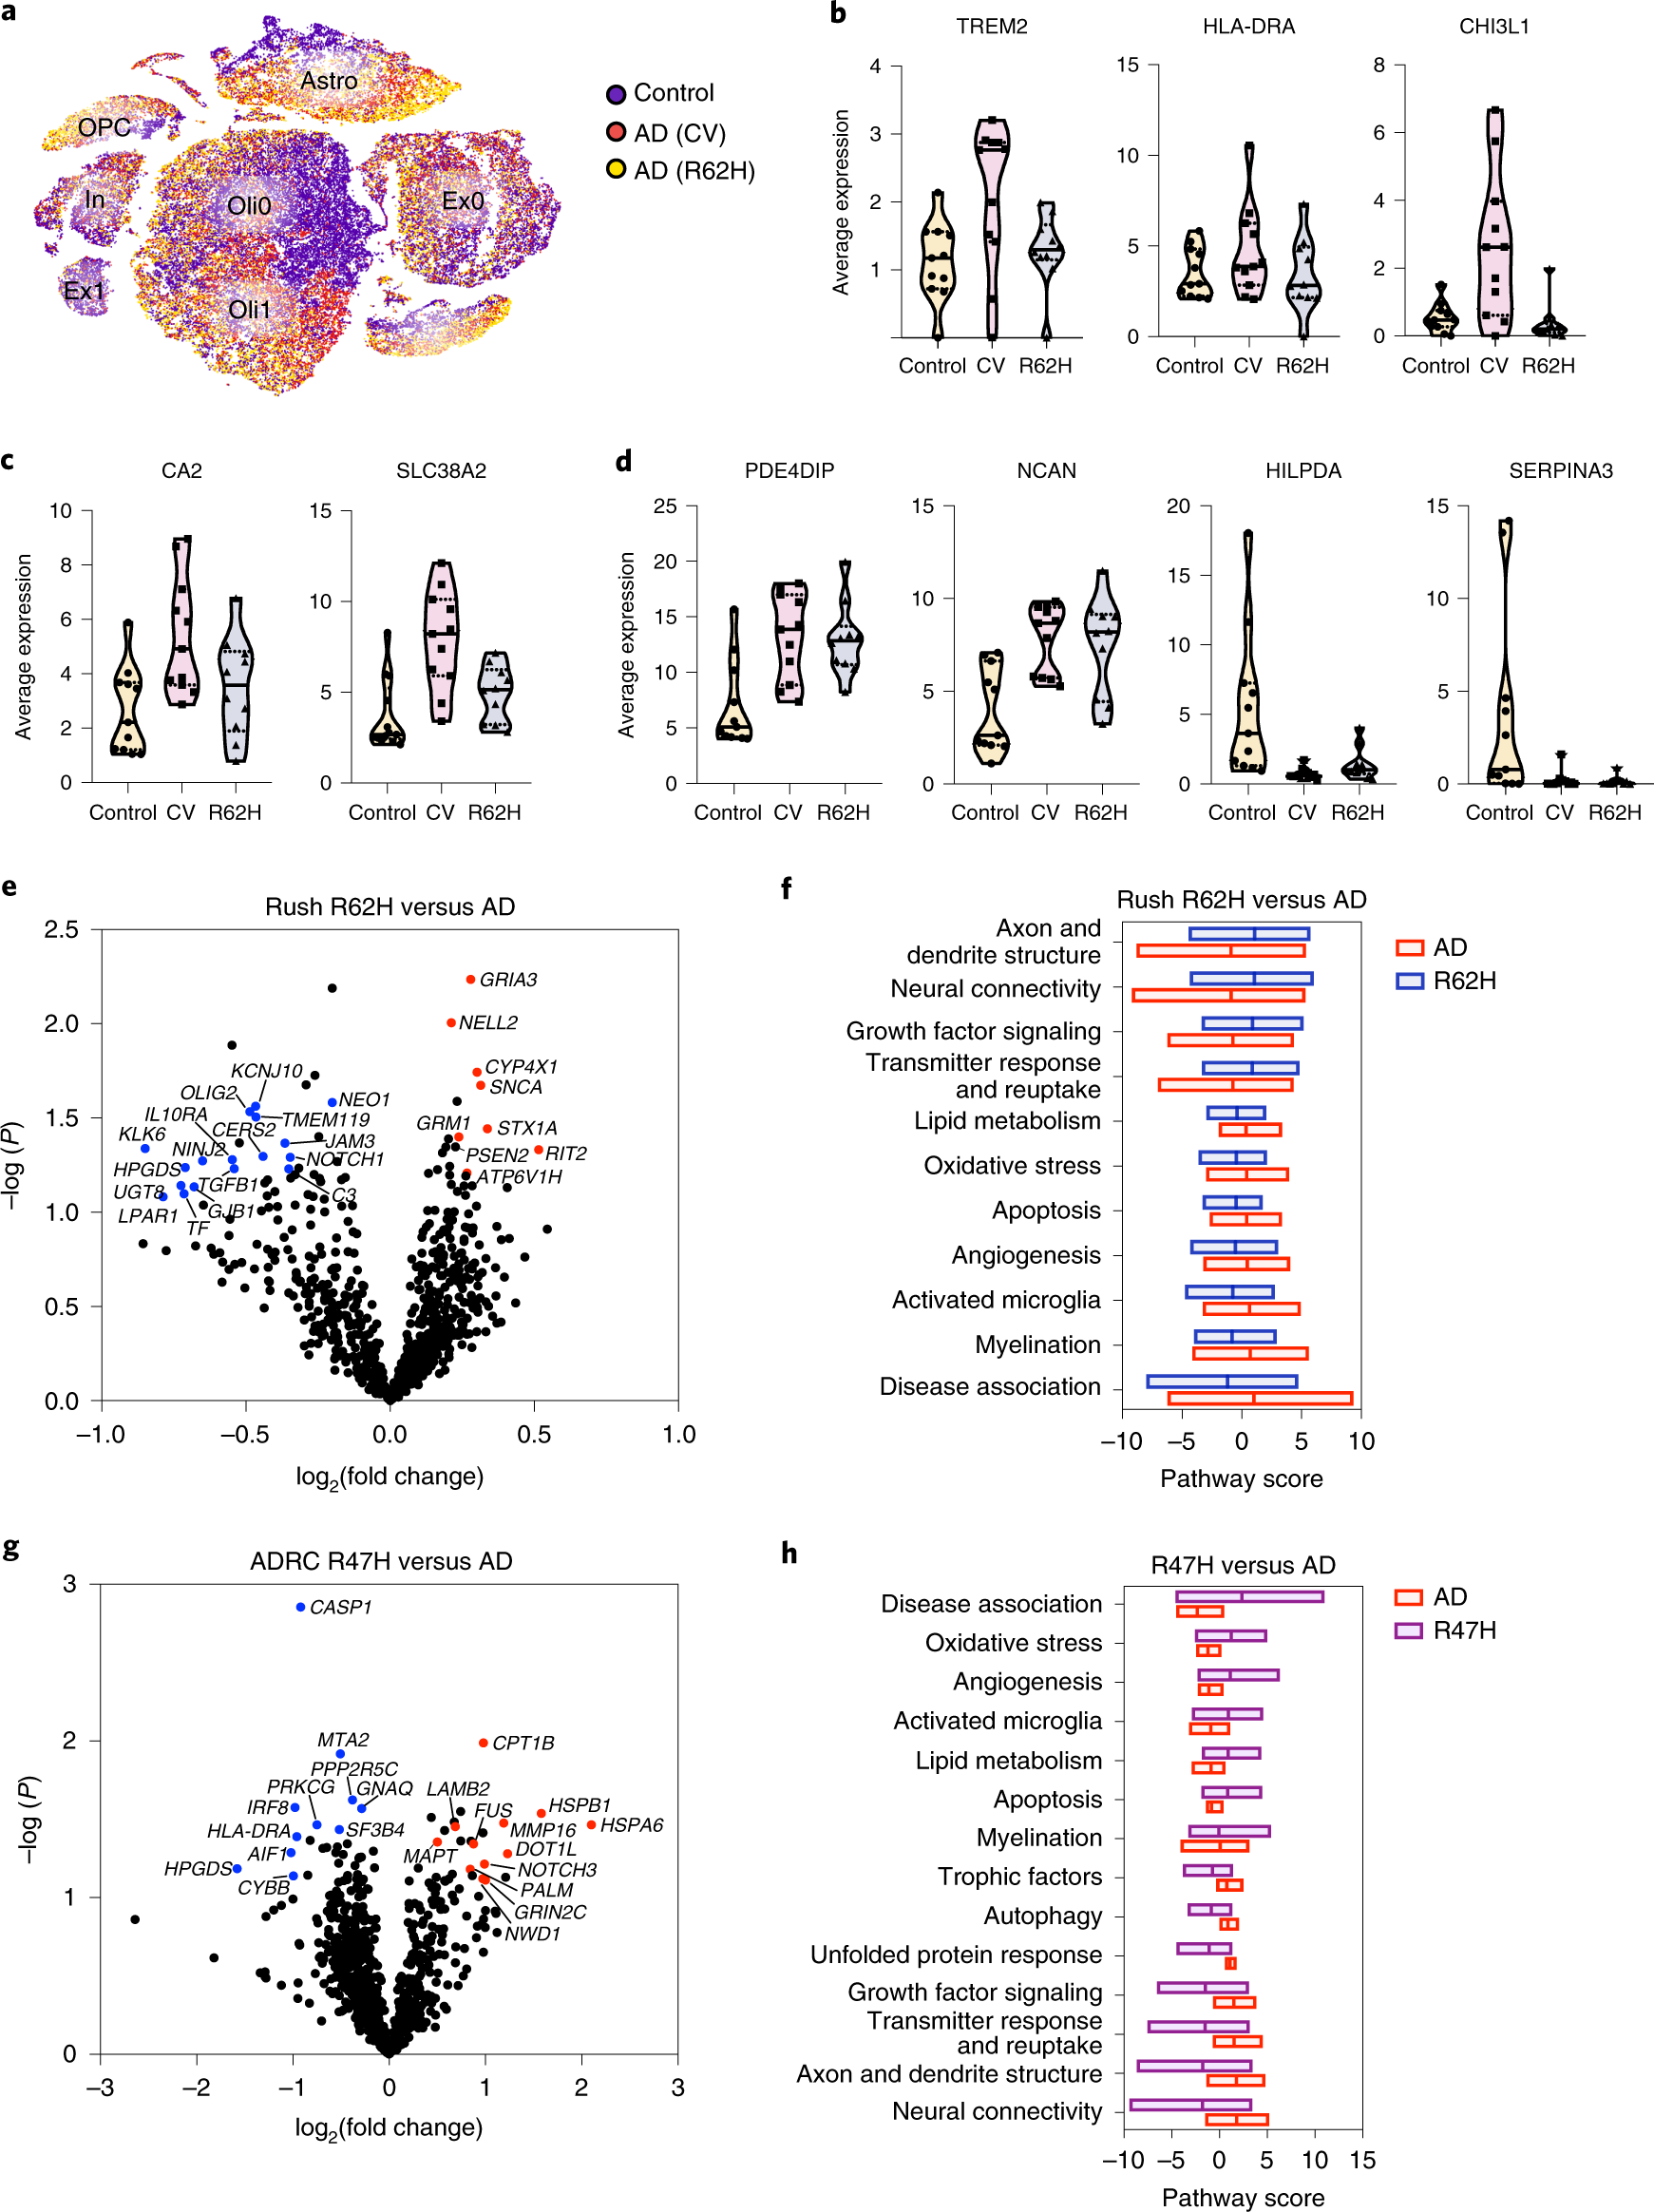
a, t-SNE plot showing the distribution of nuclei from 11 AD (CV), 10 AD (R62H) and 11 control samples. AD (CV) and AD (R62H) cluster more closely, compared with control, especially in the non-neuronal clusters. n = 32,625 control, 16,279 AD (CV) and 16,594 AD (R62H) nuclei. b–d, Violin plots showing average gene expression across microglia (b), oligodendrocyte (c) and astrocyte (d) nuclei isolated from each individual. Expression of microglial genes is significantly reduced in AD (R62H) compared with AD (CV); oligodendrocyte genes show intermediate expression in AD (R62H) compared with AD (CV) and control; and astrocyte genes show similar expression in AD (CV) and AD (R62H). Violin plots are centered around the median (black line) with quartiles (dashed lines). Minima and maxima are shown as the bottom and top of the plots. Each dot represents one individual. n = 11 control, 11 AD (CV) and 10 AD (R62H) samples. e, Volcano plot showing DEGs derived from NanoString analysis of AD brains of TREM2-CV and TREM2-R62H carriers from Rush cohorts. n = 13 AD (CV) and 11 AD (R62H) samples. P value was calculated by multivariate linear regression with Benjamini–Yekutieli adjustment. f, Pathway analysis shows defective microglia activation in R62H carriers. g, Volcano plot showing DEGs derived from NanoString analysis of AD brains of TREM2-CV and TREM2-R47H carriers from ADRC cohorts. R47H carriers have reduced expression of microglial genes. n = 5 subjects with AD (CV) and 5 subjects with AD (R47H). P value was calculated by multivariate linear regression with Benjamini–Yekutieli adjustment. h, Pathway analysis shows defective neuronal functions in R47H carriers.
Extended Data Fig. 1: Cluster characterization of 7-month-old mouse cohort.
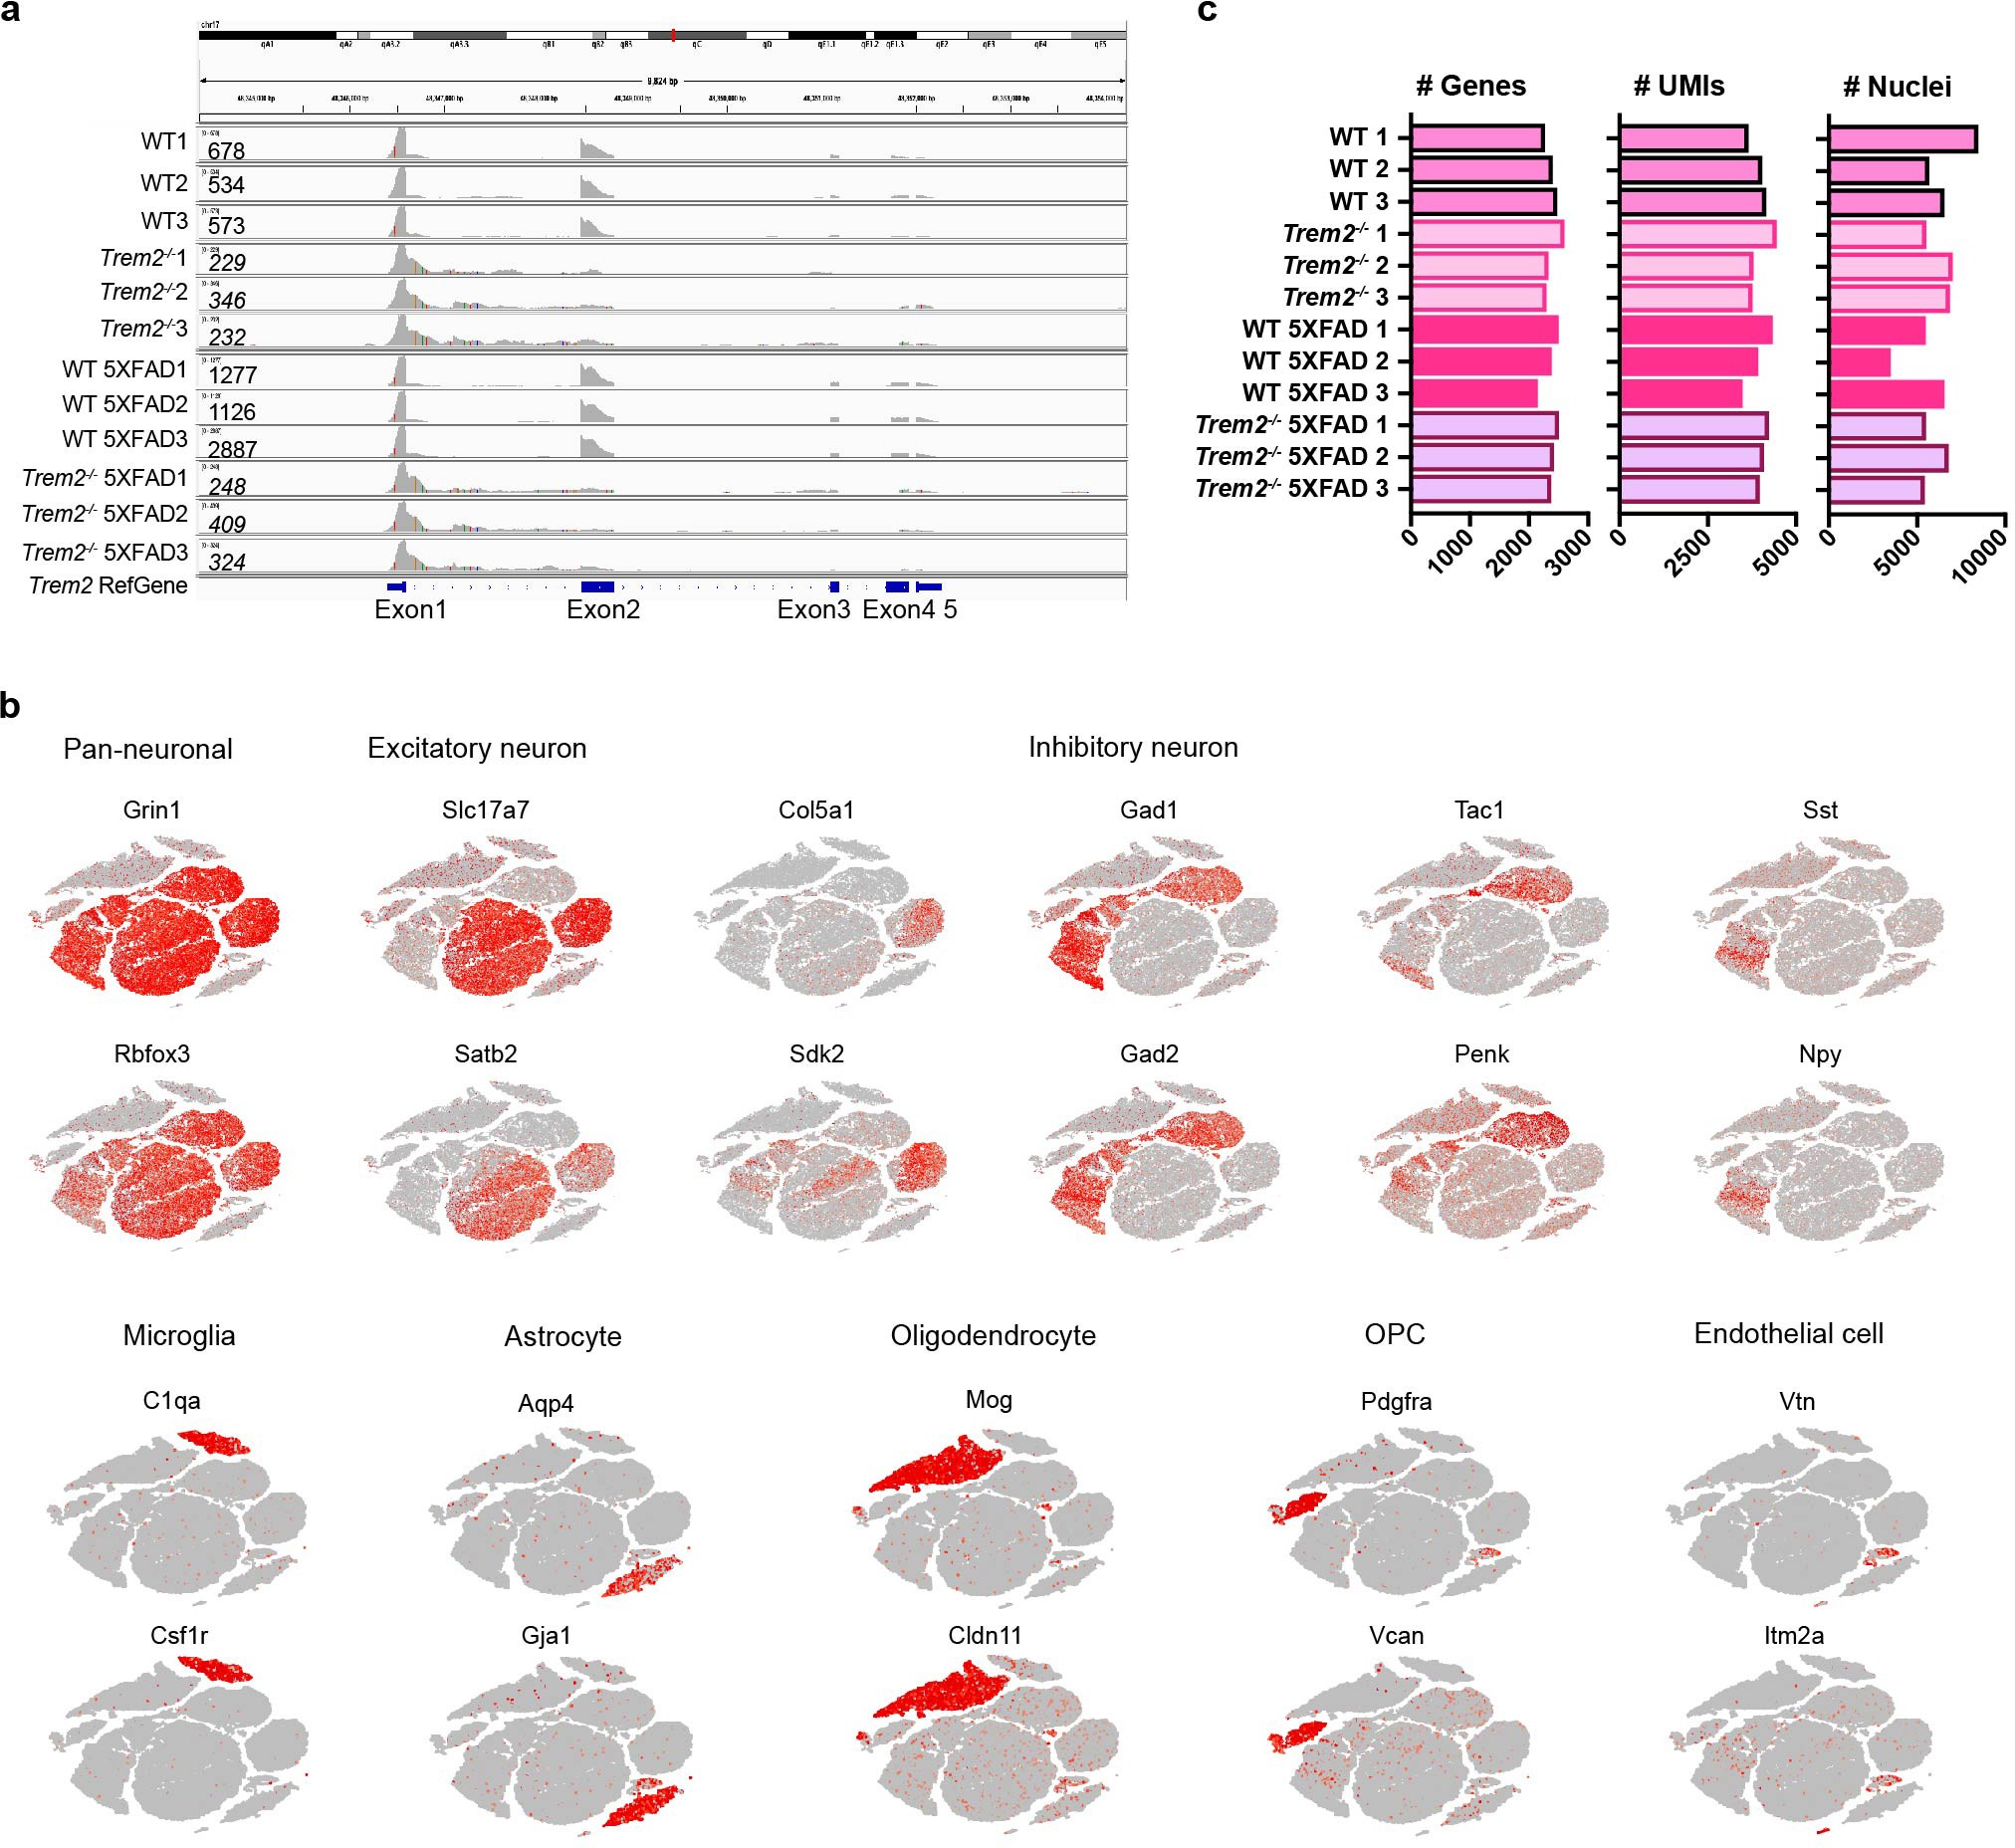
a, Alignment of Trem2 reads from all mice sequenced to the Trem2 reference genome shows knockout of Trem2 gene in Trem2**–/– and Trem2**–/– 5XFAD mice. No reads from Trem2**–/– and Trem2**–/– 5XFAD mice align to Trem2 exon 2. Alignment of reads from Trem2-deficient mice to Trem2 exon 1 reflects early transcriptional termination due to deletion of exons 3 and 4 in the design of Trem2-knockout construct. The presence of exon1 reads correspond to the use of 5′ sequencing in this cohort. Numbers on the left represent the total number of Trem2 reads from each sample. b, tSNE plots of snRNA-seq of 7-month-old mouse brain showing cell-type-specific markers identifying each cluster. n = 73,419 total nuclei. c, Bar graphs showing median of the number of genes, median of the number of UMIs and the total number of nuclei of each sample sequenced.
Extended Data Fig. 2: Cluster characterization of 15-month-old mouse cohort.
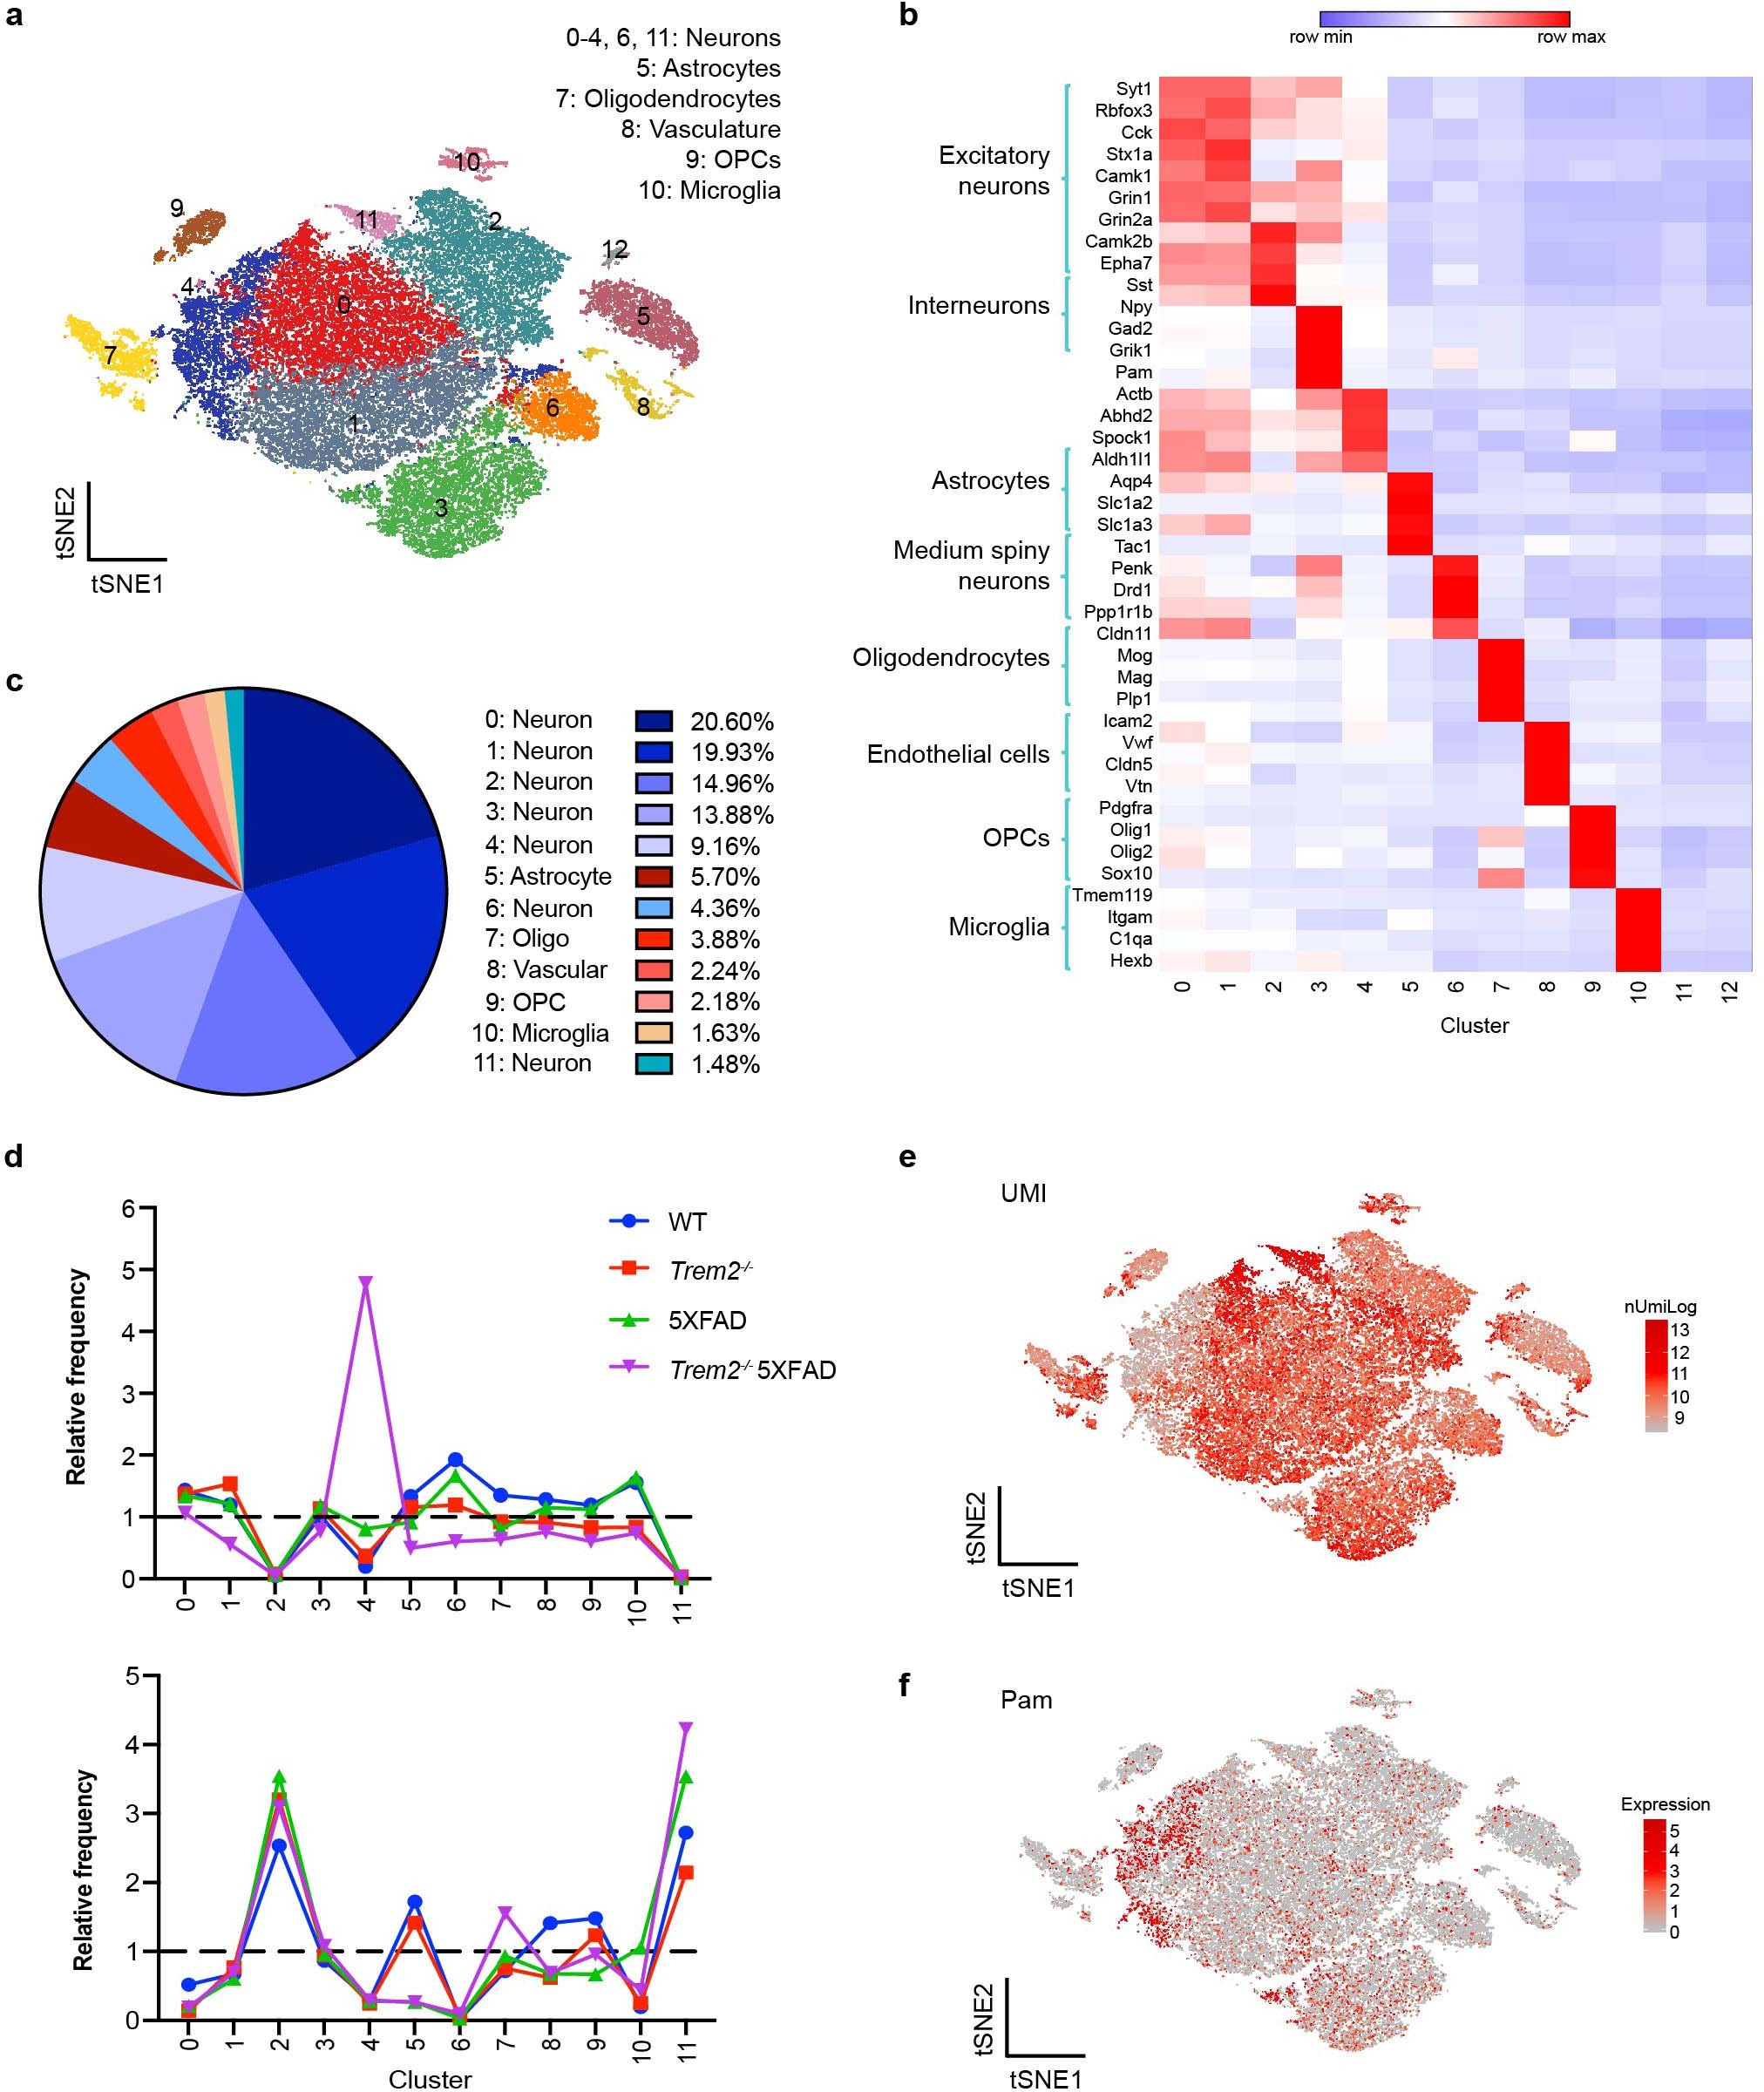
a, t-SNE plot showing 13 distinguished clusters, 0–12, with cell-type identities determined by expression of specific markers. Cluster 12 had very low frequency and did not have a clear marker profile and was thus omitted from analysis. b, Heat map showing specific markers identifying each cluster in a. Color scheme shows row max and row min. c, Pie chart showing the frequency of each cluster across all genotypes. Neuronal clusters are shown in blue hues and non-neuronal clusters are shown in red hues. d, Relative frequency of clusters in different samples, normalized to overall frequency in c, shown for cortex and hippocampus. Clusters 2 and 11 (neuronal) were exclusive to hippocampus, while clusters 0 and 6 (neuronal) were exclusive to cortex. Cluster 4 (neuronal) was enriched in Trem2**–/– 5XFAD cortex. e, Number of unique molecular identifiers (UMIs), indicative of captured reads, superimposed on the t-SNE plot from a. Cluster 4 has a lower average number of UMIs compared to other neurons. f, t-SNE plot showing expression of Pam, a representative gene enriched in cluster 4. n = 38,230 total nuclei pooled from 3 mouse brains per genotype (a,e,f).
Extended Data Fig. 3: Characterization of the microglia cluster in the 15-month-old mouse cohort.

a, t-SNE plot showing the microglia cluster (cluster 10 from Extended Data Fig. 2), expressing microglia genes, such as C1qa, Fcrls and Tyrobp. b, Volcano plots showing DEGs (fold change > 1.5, two-part hurdle model, adjusted P < 0.05, Bonferroni correction) of 5XFAD versus WT (effect of Aβ) and 5XFAD versus Trem2**–/– 5XFAD (dependence of Trem2) in microglia. c, t-SNE plot of re-clustered microglia (from cluster 10) identifying 4 sub-clusters. d, Bar graphs showing the relative frequency of sub-cluster 3 in each sample. Sub-cluster 3 is only present in the 5XFAD sample. e, Violin plots showing the expression of DAM genes, Cst7, Gpnmb and Spp1, enriched in sub-cluster 3. Violin plots are presented with floating box showing median (middle line) and quartiles (top and bottom). Minima and maxima are shown as the bottom and top of the violin plots. n = 266 WT, 92 Trem2**–/–, 171 WT 5XFAD and 88 Trem2**–/– 5XFAD microglial nuclei, pooled from 3 mouse brains per genotype (a,b,c,e).
Extended Data Fig. 4: Oligodendrocytes acquire an Aβ-dependent signature and do not cluster around plaques in the 5XFAD model.

a, Box plots showing average gene expression across oligodendrocyte nuclei isolated from each mouse in the 7-month-old cohort. Floating bars show the min and max and black line shows the mean. Each dot represents one mouse. n = 3 biologically independent mice per genotype. b, Violin plots showing expression of C4b, Serpina3n and H2-D1 in all oligodendrocytes from the 15-month-old cohort. Violin plots are presented with floating boxes showing median (middle line) and quartiles (top and bottom). Minima and maxima are shown as the bottom and top of the violin plots. n = 617 WT, 298 Trem2**–/–, 160 WT 5XFAD and 308 Trem2**–/– 5XFAD oligodendrocytes, pooled from 3 mouse brains per genotype. c, RT–qPCR from human oligodendrocyte cell line (HOG) treated with Aβ oligomers or fibrils at the indicated concentrations for 18 h showing Aβ directly induces C4. n = 3 biologically independent cell cultures. d, RT–qPCR from HOG treated with soluble factors (GPNMB or alpha-2-macroglobulin) for 24 h or a cocktail of cytokines (IL-1β, IL-6, TNF-α, IFN-α, IFN-γ) for 8 h showing induced C4. n = 3 biologically independent cell cultures. e, Representative immunofluorescence images of Olig2 and plaque staining in 5-month-old WT 5XFAD and Trem2**–/– 5XFAD cortices. n = 6 mice per genotype. Scale bar, 50 μm. f, Quantification of density of Olig2+ nuclei within 15 μm or 30 μm shell around plaque surfaces in the cortex in e, n = 6 mice per genotype. g, Quantification of total number of CA2+ oligodendrocytes in all 4 genotypes at 7 months of age. n = 3 mice per genotype. h, Representative immunofluorescence images of Serpina3n staining in 7-month-old mice of all genotypes showing colocalization of Serpina3n with oligodendrocyte marker CA2. White arrow heads indicate colocalization. n = 3 mice per genotype. Scale bar, 15 μm. i, Automated quantification of Serpina3n intensity in CA2+ oligodendrocytes in h. n = 3 mice per genotype. j, Representative confocal images showing colocalization of Serpina3n with GFAP+ astrocytes in 15-month-old 5XFAD mice. n = 3 mice per genotype. CC, corpus callosum. Scale bar, 50 μm. Inset, enlarged image detail. k, Representative confocal images showing colocalization of Serpina3n with X04+ plaques in 15-month-old 5XFAD mice. IV, V and VI indicate corresponding cortical layers. n = 3 mice per genotype. Scale bar, 60 μm. l, Thioflavin T fluorescence of Aβ42 aggregation with the addition of combinations of proteins at indicated concentrations in microplate shaking assay. n = 5 independent wells for the aggregation reactions; data represent two independent experiments. P value by one-way ANOVA, Tukey’s multiple comparisons test (a,g,i) or unpaired t-test, two-tailed (c). All data are presented as mean ± s.e.m.
Extended Data Fig. 5: Heat maps of fold changes of DEGs in OPC, astrocyte and neuron clusters in the 7-month-old mouse cohort.

Cluster-by-cluster analysis of differential gene expression. Heat maps showing the top 30 (or less) DEGs (fold change > 1.5, two-part hurdle model, adjusted P value < 0.05, Bonferroni correction), ordered by adjusted P value, and results are presented for comparisons of 5XFAD versus WT. Numbers indicate log2(fold change). Analyses are presented for the following clusters: a, cluster 8 (OPC), n = 485 5XFAD and 705 WT nuclei; b, cluster 6 (astrocytes), n = 490 5XFAD and 1,088 WT nuclei; c, cluster 0 (excitatory neurons), n = 3,302 5XFAD and 4,396 WT nuclei; d, cluster 3 (excitatory neurons), n = 1,941 5XFAD and 3,038 WT nuclei; e, cluster 5 (excitatory neurons), n = 1,530 5XFAD and 1,912 WT nuclei; f, cluster 1 (inhibitory neurons), n = 2,606 5XFAD and 3,315 WT nuclei; and g, cluster 4 (inhibitory neurons), n = 1,672 5XFAD and 2,660 WT nuclei. n = 3 biologically independent mouse brain samples per genotype. The lists of genes are in Supplementary Table 1.
Extended Data Fig. 6: Proteomic analysis recapitulates major findings from snRNA-seq analysis.
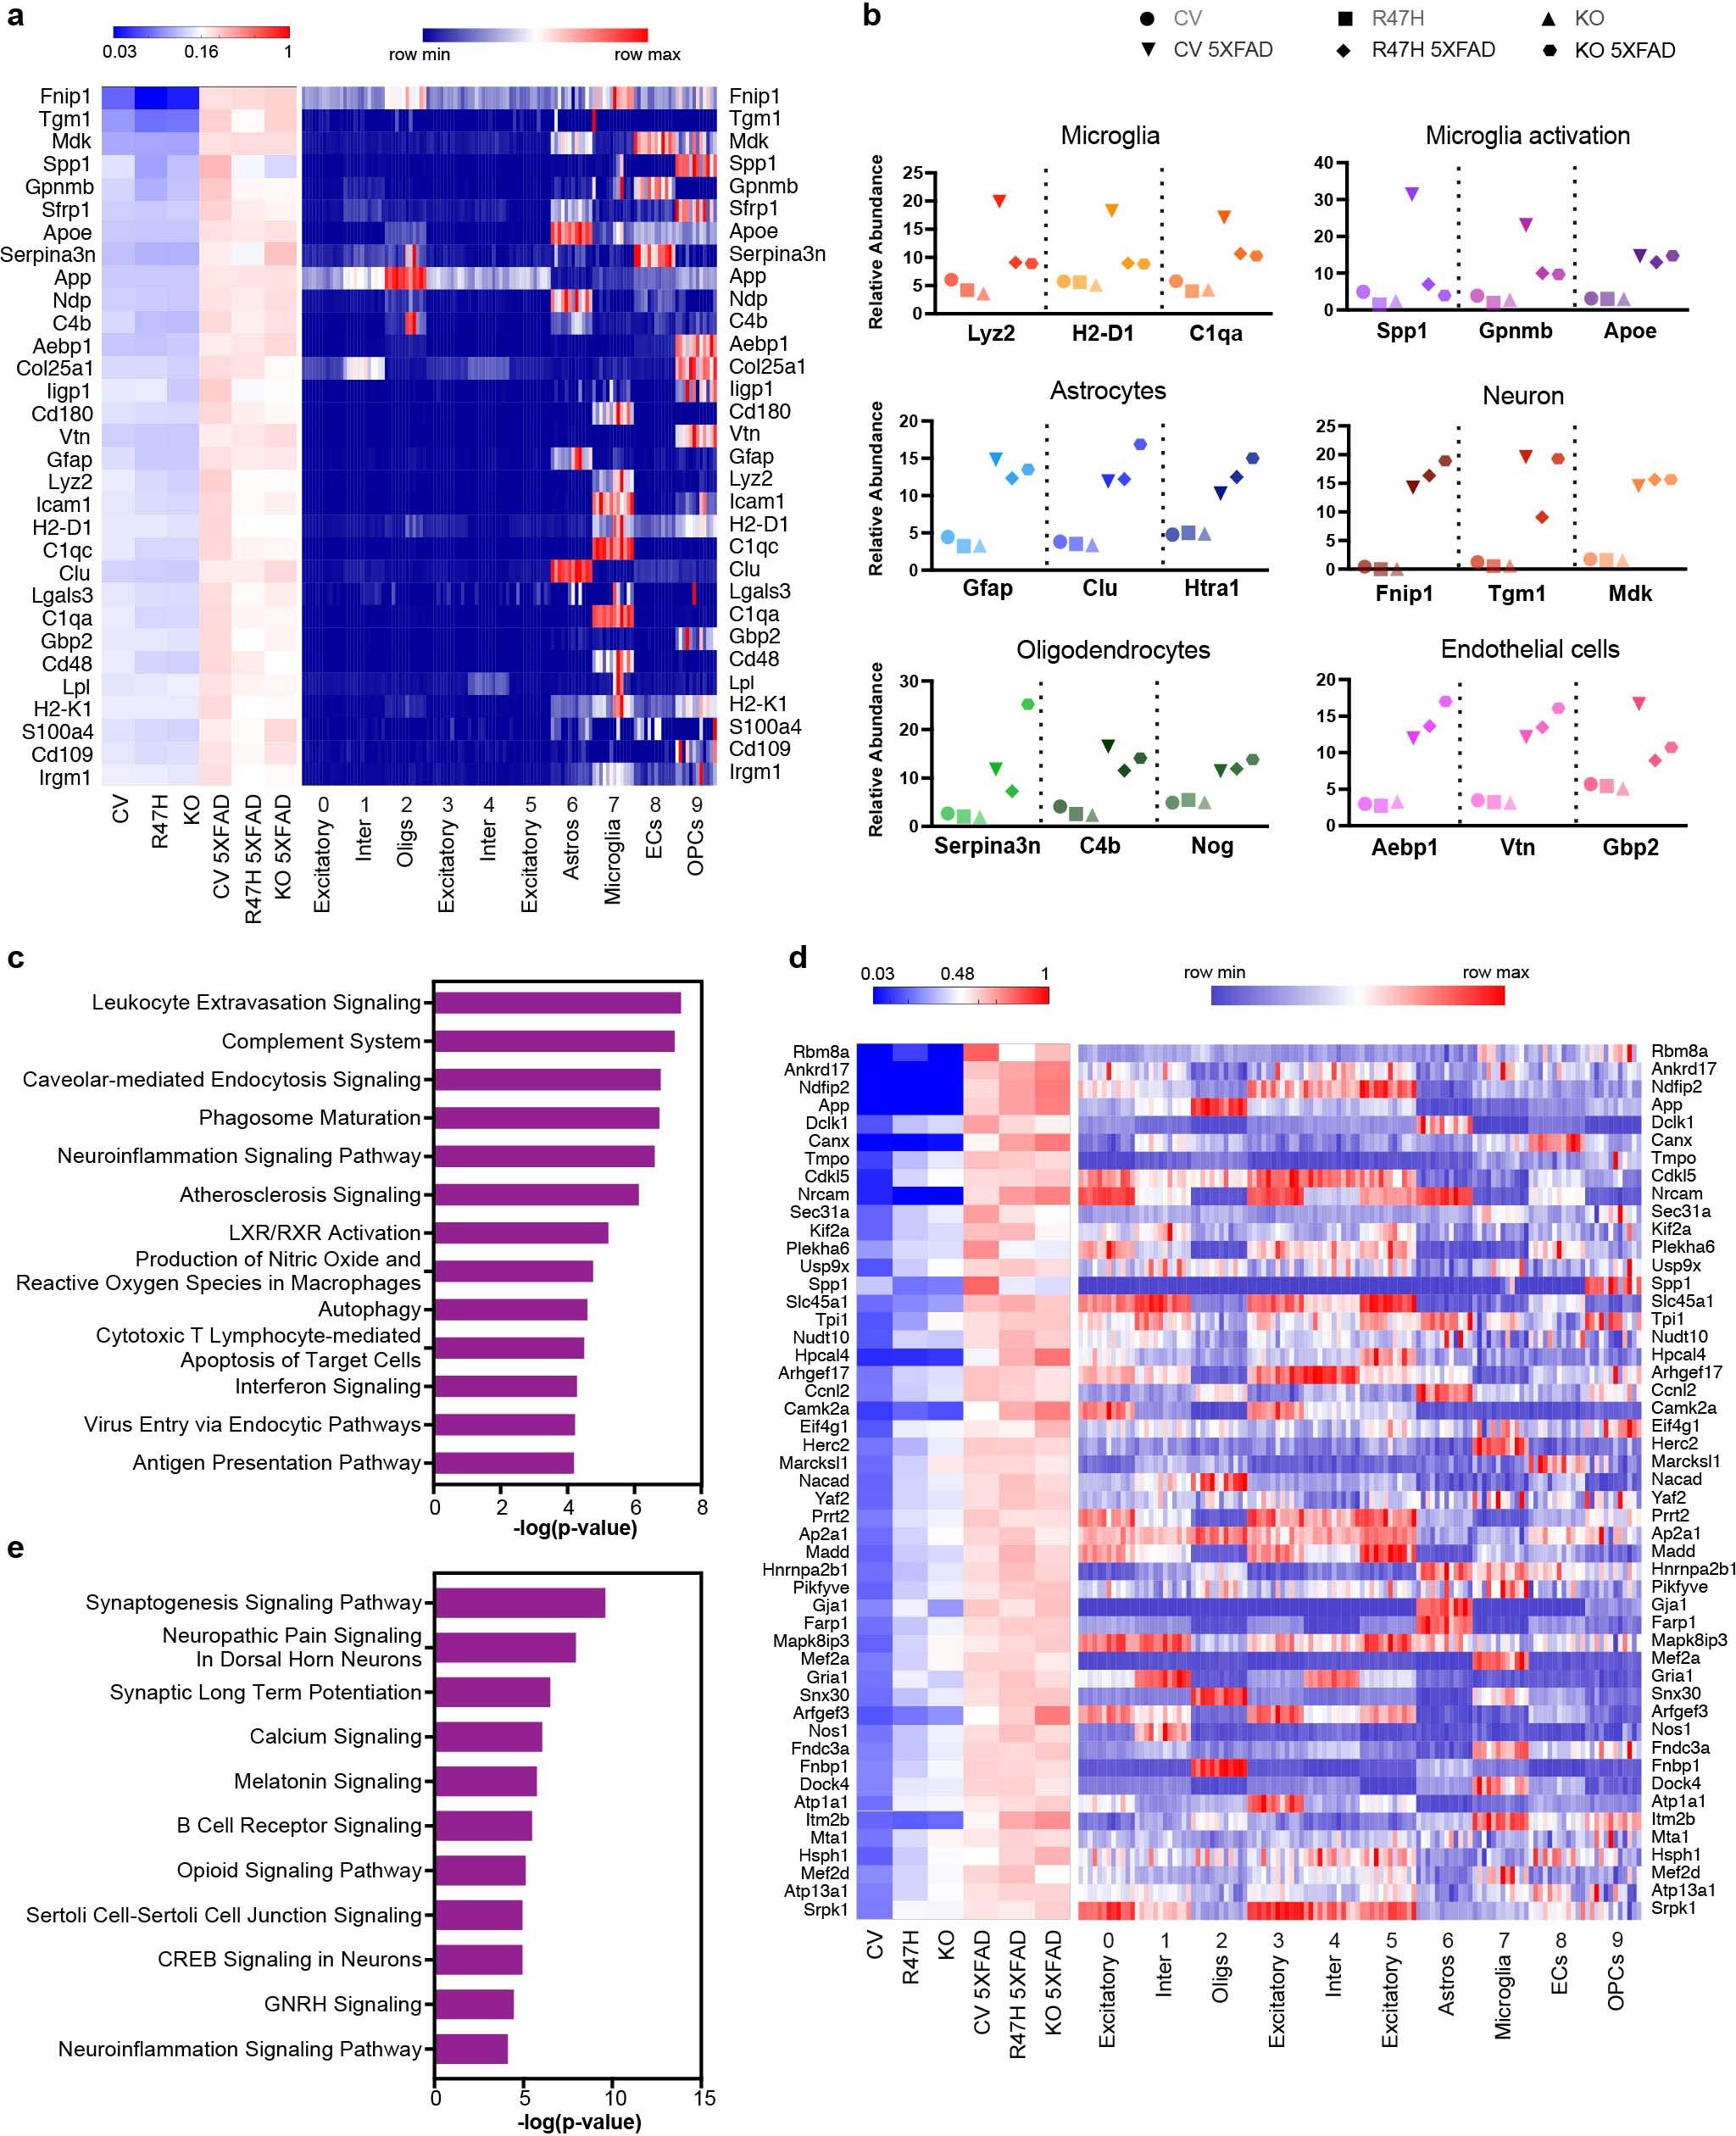
a, Left, Heat map of relative abundance of the most significantly upregulated proteins from proteomics in CV 5XFAD compared with CV mice, ranked by fold change. Total protein analysis was conducted on brain tissues from 10-month-old CV, R47H, Trem2**–/– (KO), CV 5XFAD, R47H 5XFAD and KO 5XFAD mice. Right, Heat map showing average expression of corresponding gene in each cluster in snRNA-seq of every mouse from 7-month-old cohort. Each column represents one individual mouse. Within a cluster, mice from left to right: WT1–3, Trem2**–/–1–3, WT 5XFAD1–3, Trem2**–/– 5XFAD1–3. b, Relative abundance of selected proteins upregulated in different cell types. c, IPA analysis showing pathways upregulated in CV-5XFAD compared with CV mice in proteomics. n = 312 genes, Fisher’s exact test. d, Left, Heat map of relative abundance of proteins with the most significantly upregulated phospho-peptides from phospho-proteomics in CV 5XFAD compared with CV mice, ranked by fold change. Right, Heat map showing average expression of corresponding gene in each cluster in snRNA-seq of every mouse from 7-month-old cohort. Each column represents one individual mouse. Within a cluster, mice from left to right: WT1–3, Trem2**–/–1–3, WT 5XFAD1–3, Trem2**–/– 5XFAD1–3. e, IPA analysis showing pathways upregulated in CV-5XFAD compared to CV mice in phospho-proteomics. n = 270 genes, Fisher’s exact test.
Extended Data Fig. 7: Characterization of human snRNA-seq.
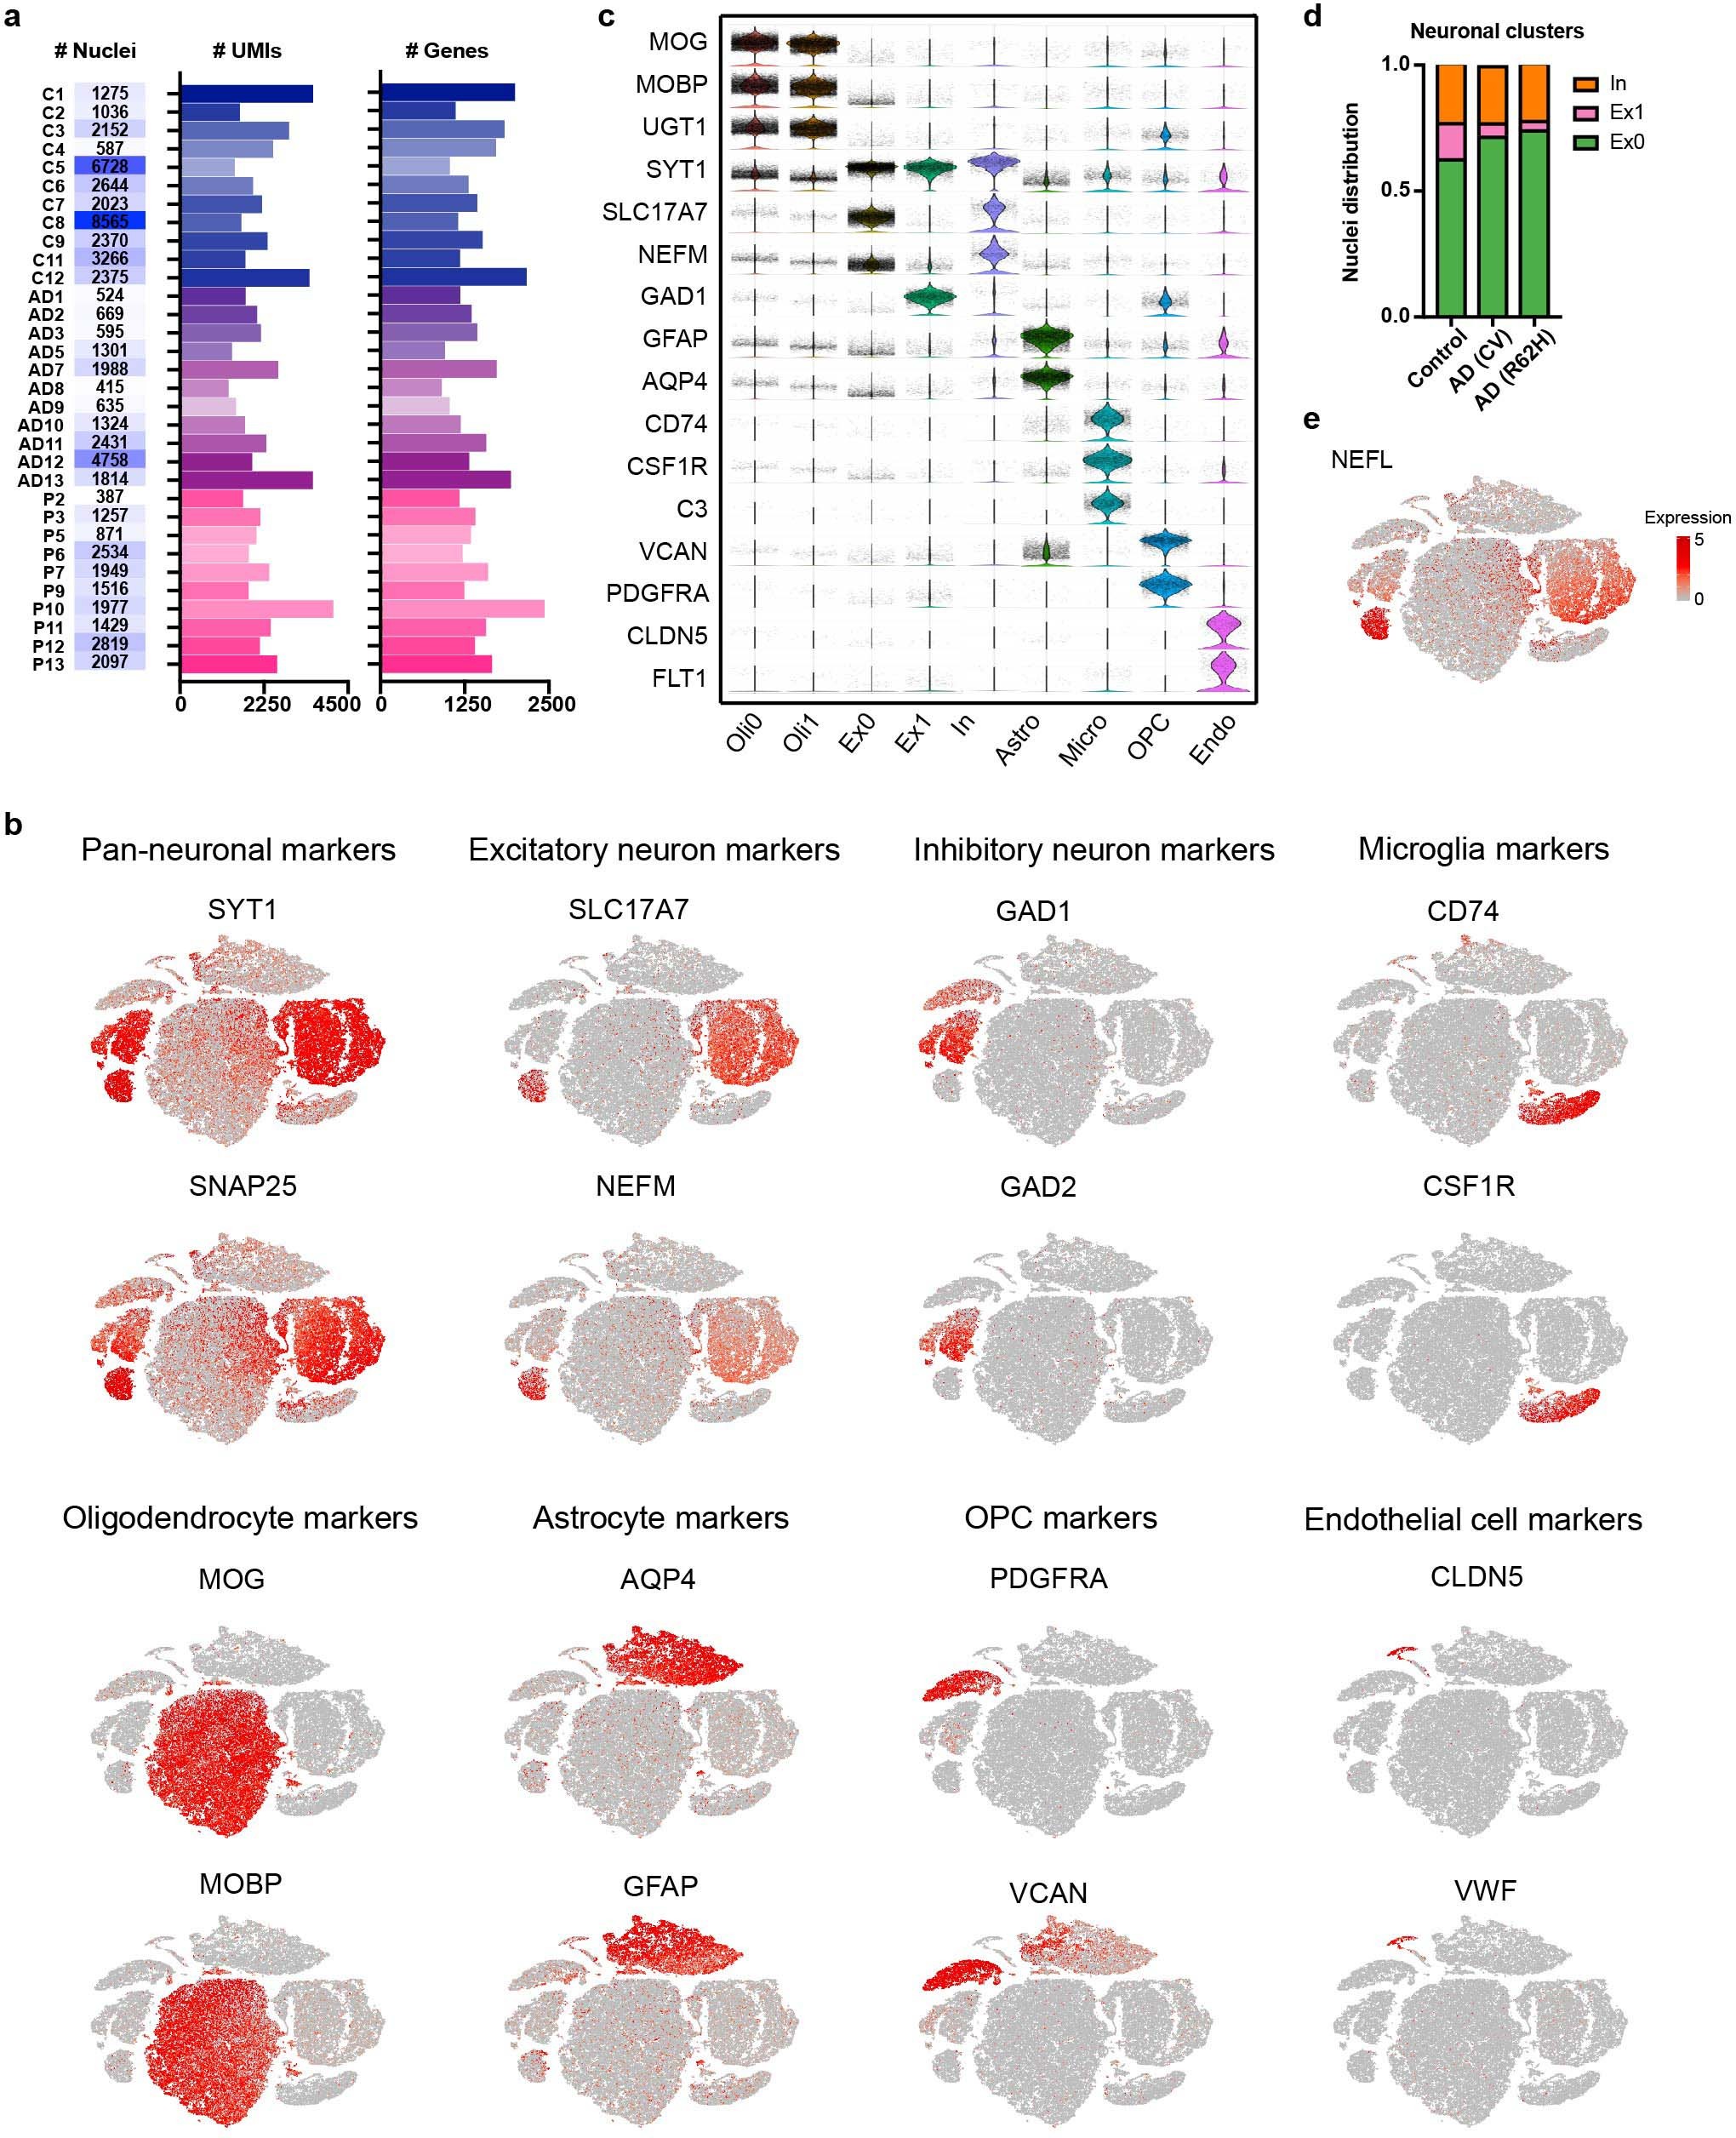
a, Total number of nuclei, median of number of UMIs and median of number of genes of each human sample sequenced. C, control; AD, AD (CV); P, AD (R62H). b, t-SNE plots of human snRNA-seq showing cell-type-specific markers identifying each cluster. n = 66,311 total nuclei. c, Violin plots showing expression of known cell type markers that define each cluster. Total number of nuclei in each cluster: 16,156 in Oli0, 13,322 in Oli1, 12,806 in Ex0, 1,869 in Ex1, 4,256 in In, 9,019 in Astro, 3,986 in Micro, 3,243 in OPC, 841 in Endo. Violin plots are centered around the median and shape represents cell distribution. d, Bar graph presenting frequency of nuclei in each neuronal sub-cluster across all neuronal nuclei, comparing AD (CV), AD (R62H) versus control samples. e, t-SNE plot showing expression of NEFL in neuronal clusters, especially in cluster Ex1. n = 66,311 total nuclei.
Extended Data Fig. 8: AD-associated human signatures are distinct from those in the Aβ mouse model.

a, Heatmaps showing fold change of top DEGs (log2(fold change) > 0.5, two-part hurdle model, adjusted P < 0.05, Bonferroni correction) between AD (CV) and control in all clusters. Left, Genes upregulated in AD. Right, Genes downregulated in AD. Numbers indicate log2(fold change). n = 11 subjects with AD (CV) and 11 controls. b, Violin plots showing expression of mouse DAM genes in 7- and 15-month-old mouse snRNA-seq and their homologs in human snRNA-seq within the microglia cluster. Violin plots are presented with floating boxes showing median (middle line) and quartiles (top and bottom). Minima and maxima are shown as the bottom and top of the violin plots. 7-month-old mouse, n = 3 biologically independent mouse brains per genotype, 524 WT, 582 Trem2**–/–, 1,123 WT 5XFAD and 604 Trem2**–/– 5XFAD microglial nuclei; 15-month-old mouse, n = 266 WT, 92 Trem2**–/–, 171 WT 5XFAD and 88 Trem2**–/– 5XFAD microglial nuclei, pooled from 3 mouse brains per genotype; human, n = 11 controls, 1,547 nuclei; 11 subjects with AD, 919 nuclei. c, t-SNE plots showing the cell type of origin of selected DAM genes in the human brain. CST7 was not detectable in any cluster. GPNMB and LPL were expressed in OPCs. Color scheme shows expression. n = 66,311 total nuclei. d, Gating strategy for viral transduced BMDMs. WT BMDMs were transduced with virus containing empty pESV-ires-eGFP vector or Irf8-overexpressing (OE) pESV-Irf8-ires-eGFP vector. Successfully transduced cells were identified by GFP+ gate. e, Gating strategy for WT and Irf8**–/– BMDMs. f, Heatmap representing the average gene expression of top microglia DEGs in microglia sub-clusters in AD versus control samples. Microglia subclusters are indicated in the top left t-SNE plot. Color scheme shows row max and row min. g, t-SNE projection of all nuclei in AD versus control samples showing the lack of a sub-population of astrocytes in AD. Red circle indicates the population. Colors correspond to individual clusters. n = 66,311 total nuclei. h, t-SNE plots showing the average z-scores of downregulated genes in astrocytes. Red circle indicates the disappearing population enriched for downregulated genes. n = 65 downregulated genes in astrocytes listed in Supplementary Table 4 were used as inputs. i, t-SNE plots of oligodendrocyte sub-clusters showing average z-scores of DEGs in oligodendrocytes. Top, Upregulated genes are enriched in Oligo0 and Oligo3 (indicated in Fig.5). Bottom, Downregulated genes are enriched in Oligo1 and Oligo2. Oligodendrocyte subclusters are indicated in the top left t-SNE plot. n = 20 up- and 23 downregulated genes in oligodendrocytes listed in Supplementary Table 4 were used as inputs.
Extended Data Fig. 9: Human AD-associated oligodendrocyte and microglia signatures identified by snRNA-seq match public datasets from aging and early-onset AD populations.
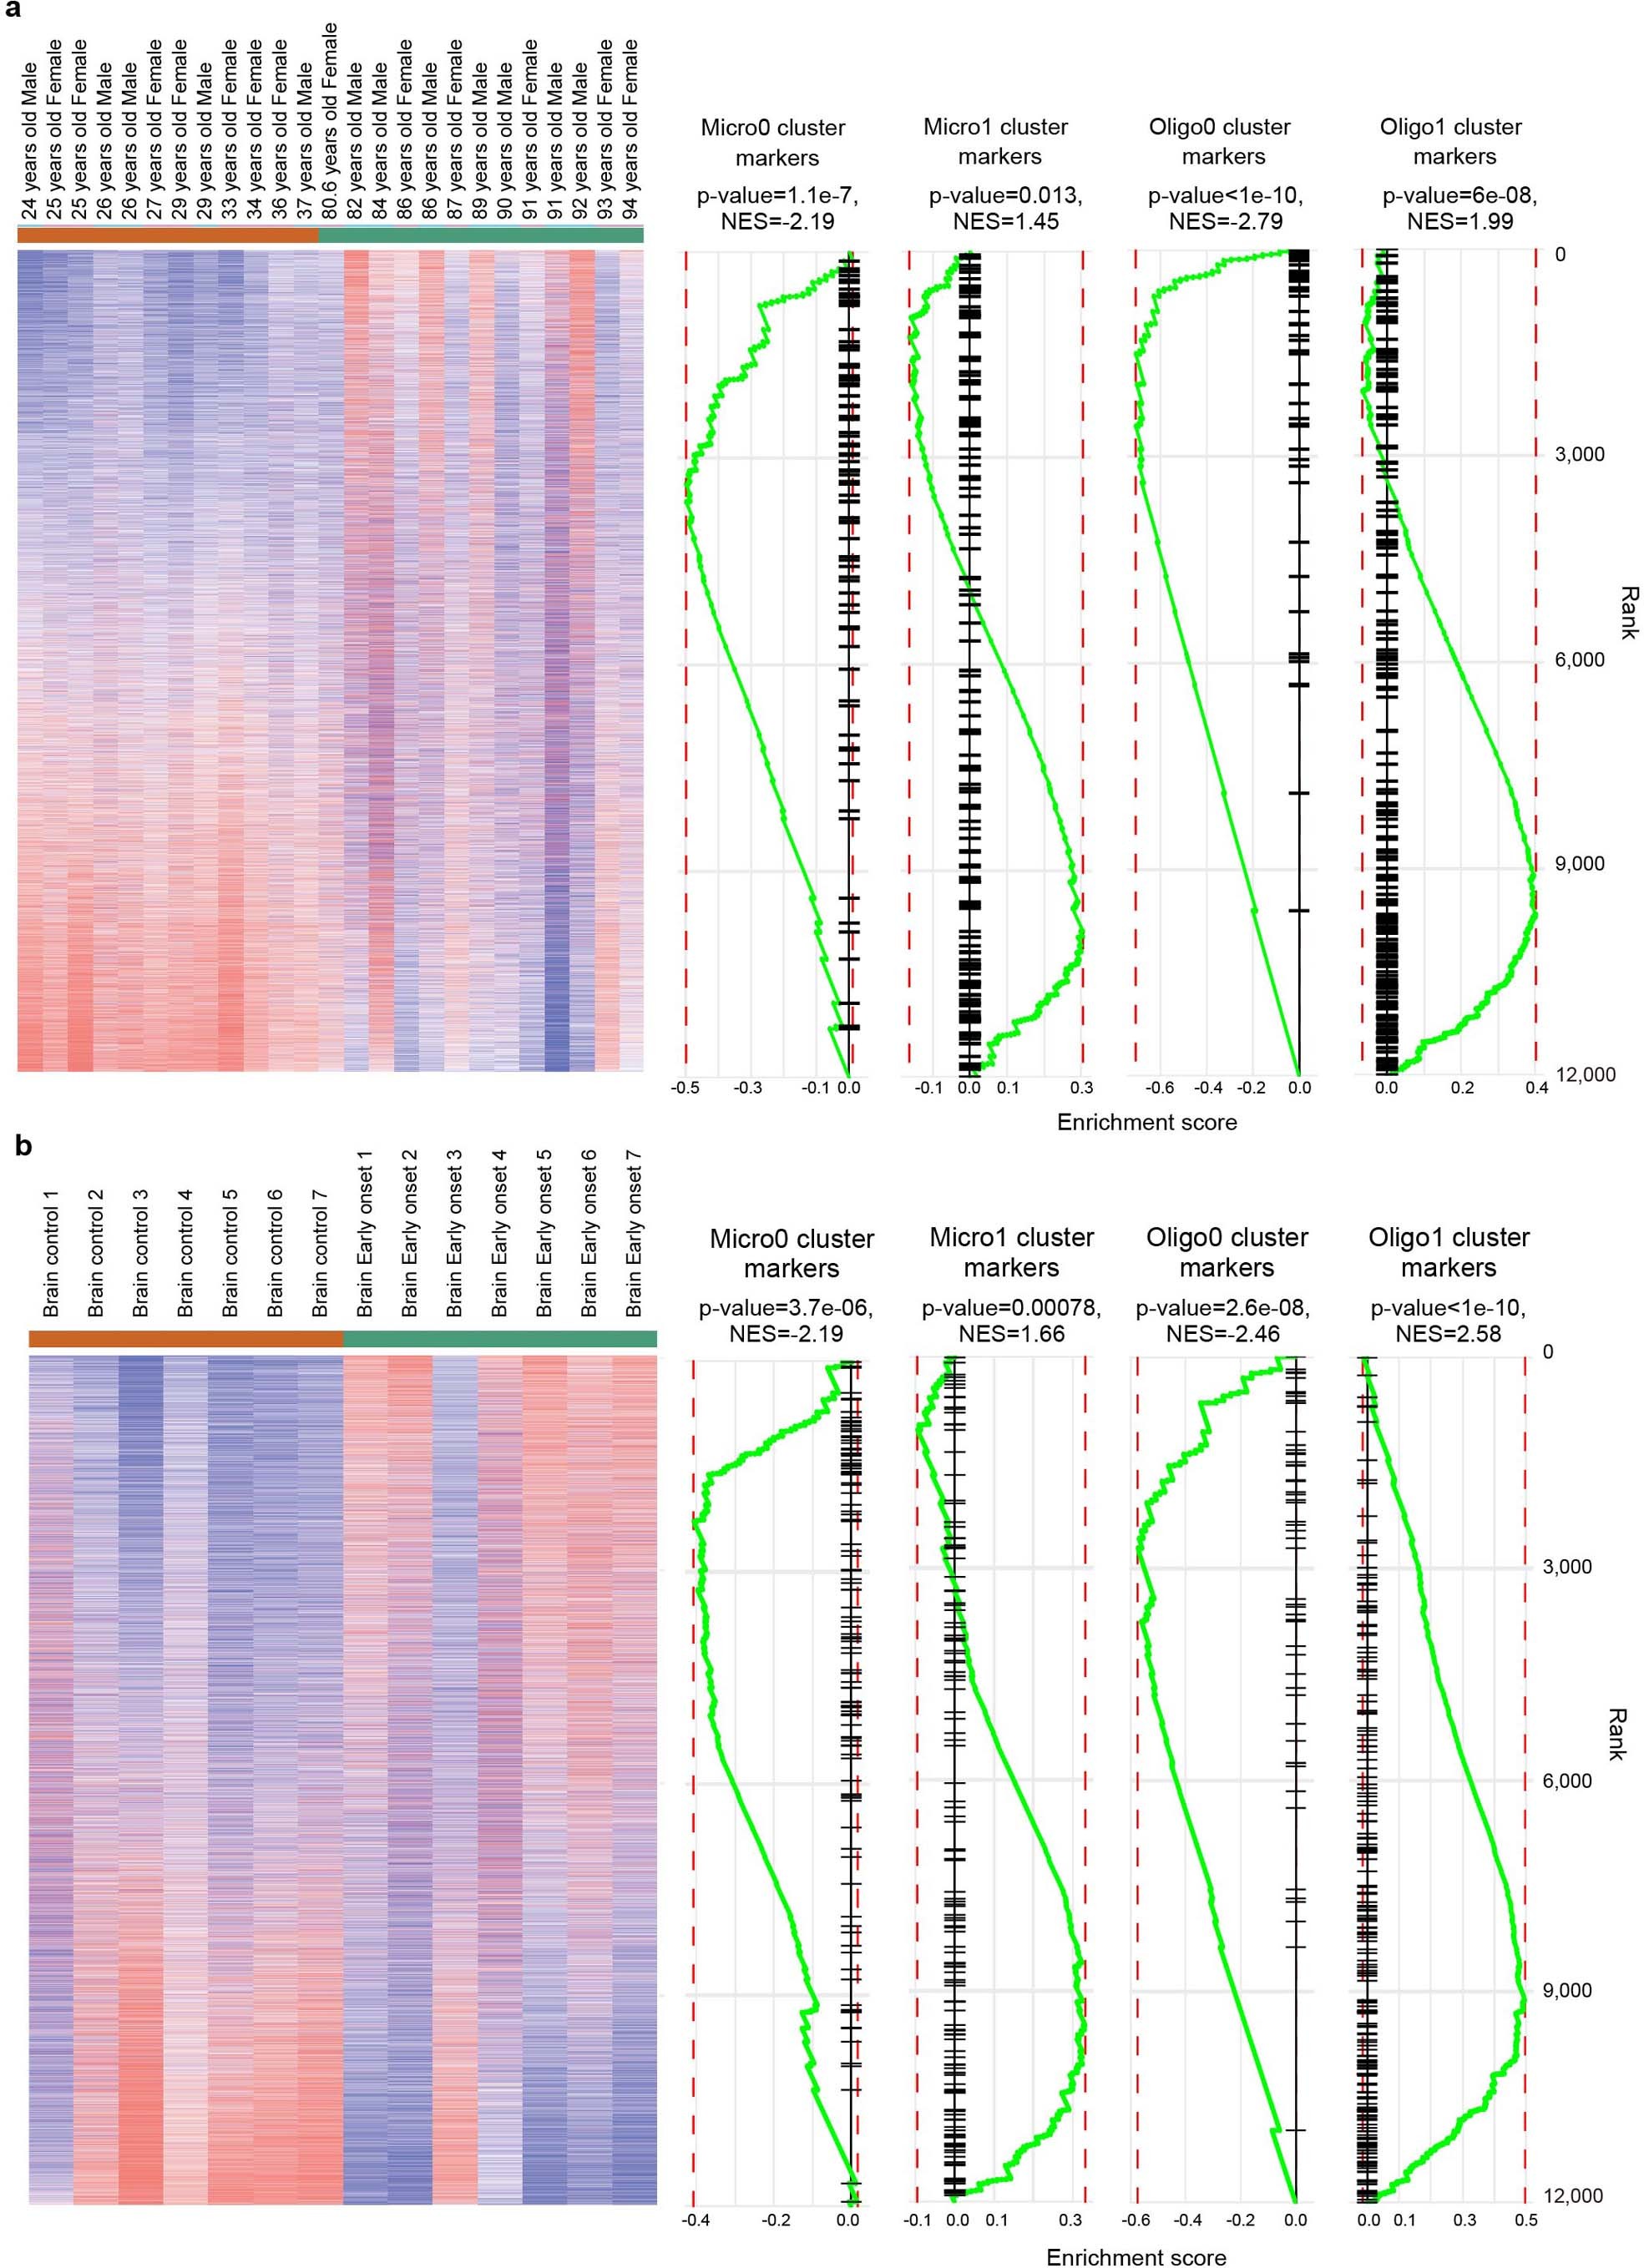
Cluster markers of Micro0, Micro1, Olig0 and Oligo1 (listed in Supplementary Table 4) were used as inputs for GSEA analysis against public datasets on aging (a, GSE53890) and people with early-onset AD (b, GSE39420). Genes enriched in Micro0 and Oligo0 correspond to genes previously identified as upregulated in human aging and people with early-onset AD. Genes enriched in Micro1 and Oligo1 correlate with downregulation in aging and early-onset AD. n = 146 genes for Micro0, 178 genes for Micro1, 59 genes for Oligo0 and 233 genes for Oligo1 were used as inputs. P value by permutation test.
Extended Data Fig. 10: NanoString nCounter analysis of two cohorts of subjects with AD corroborates findings in snRNA-seq.
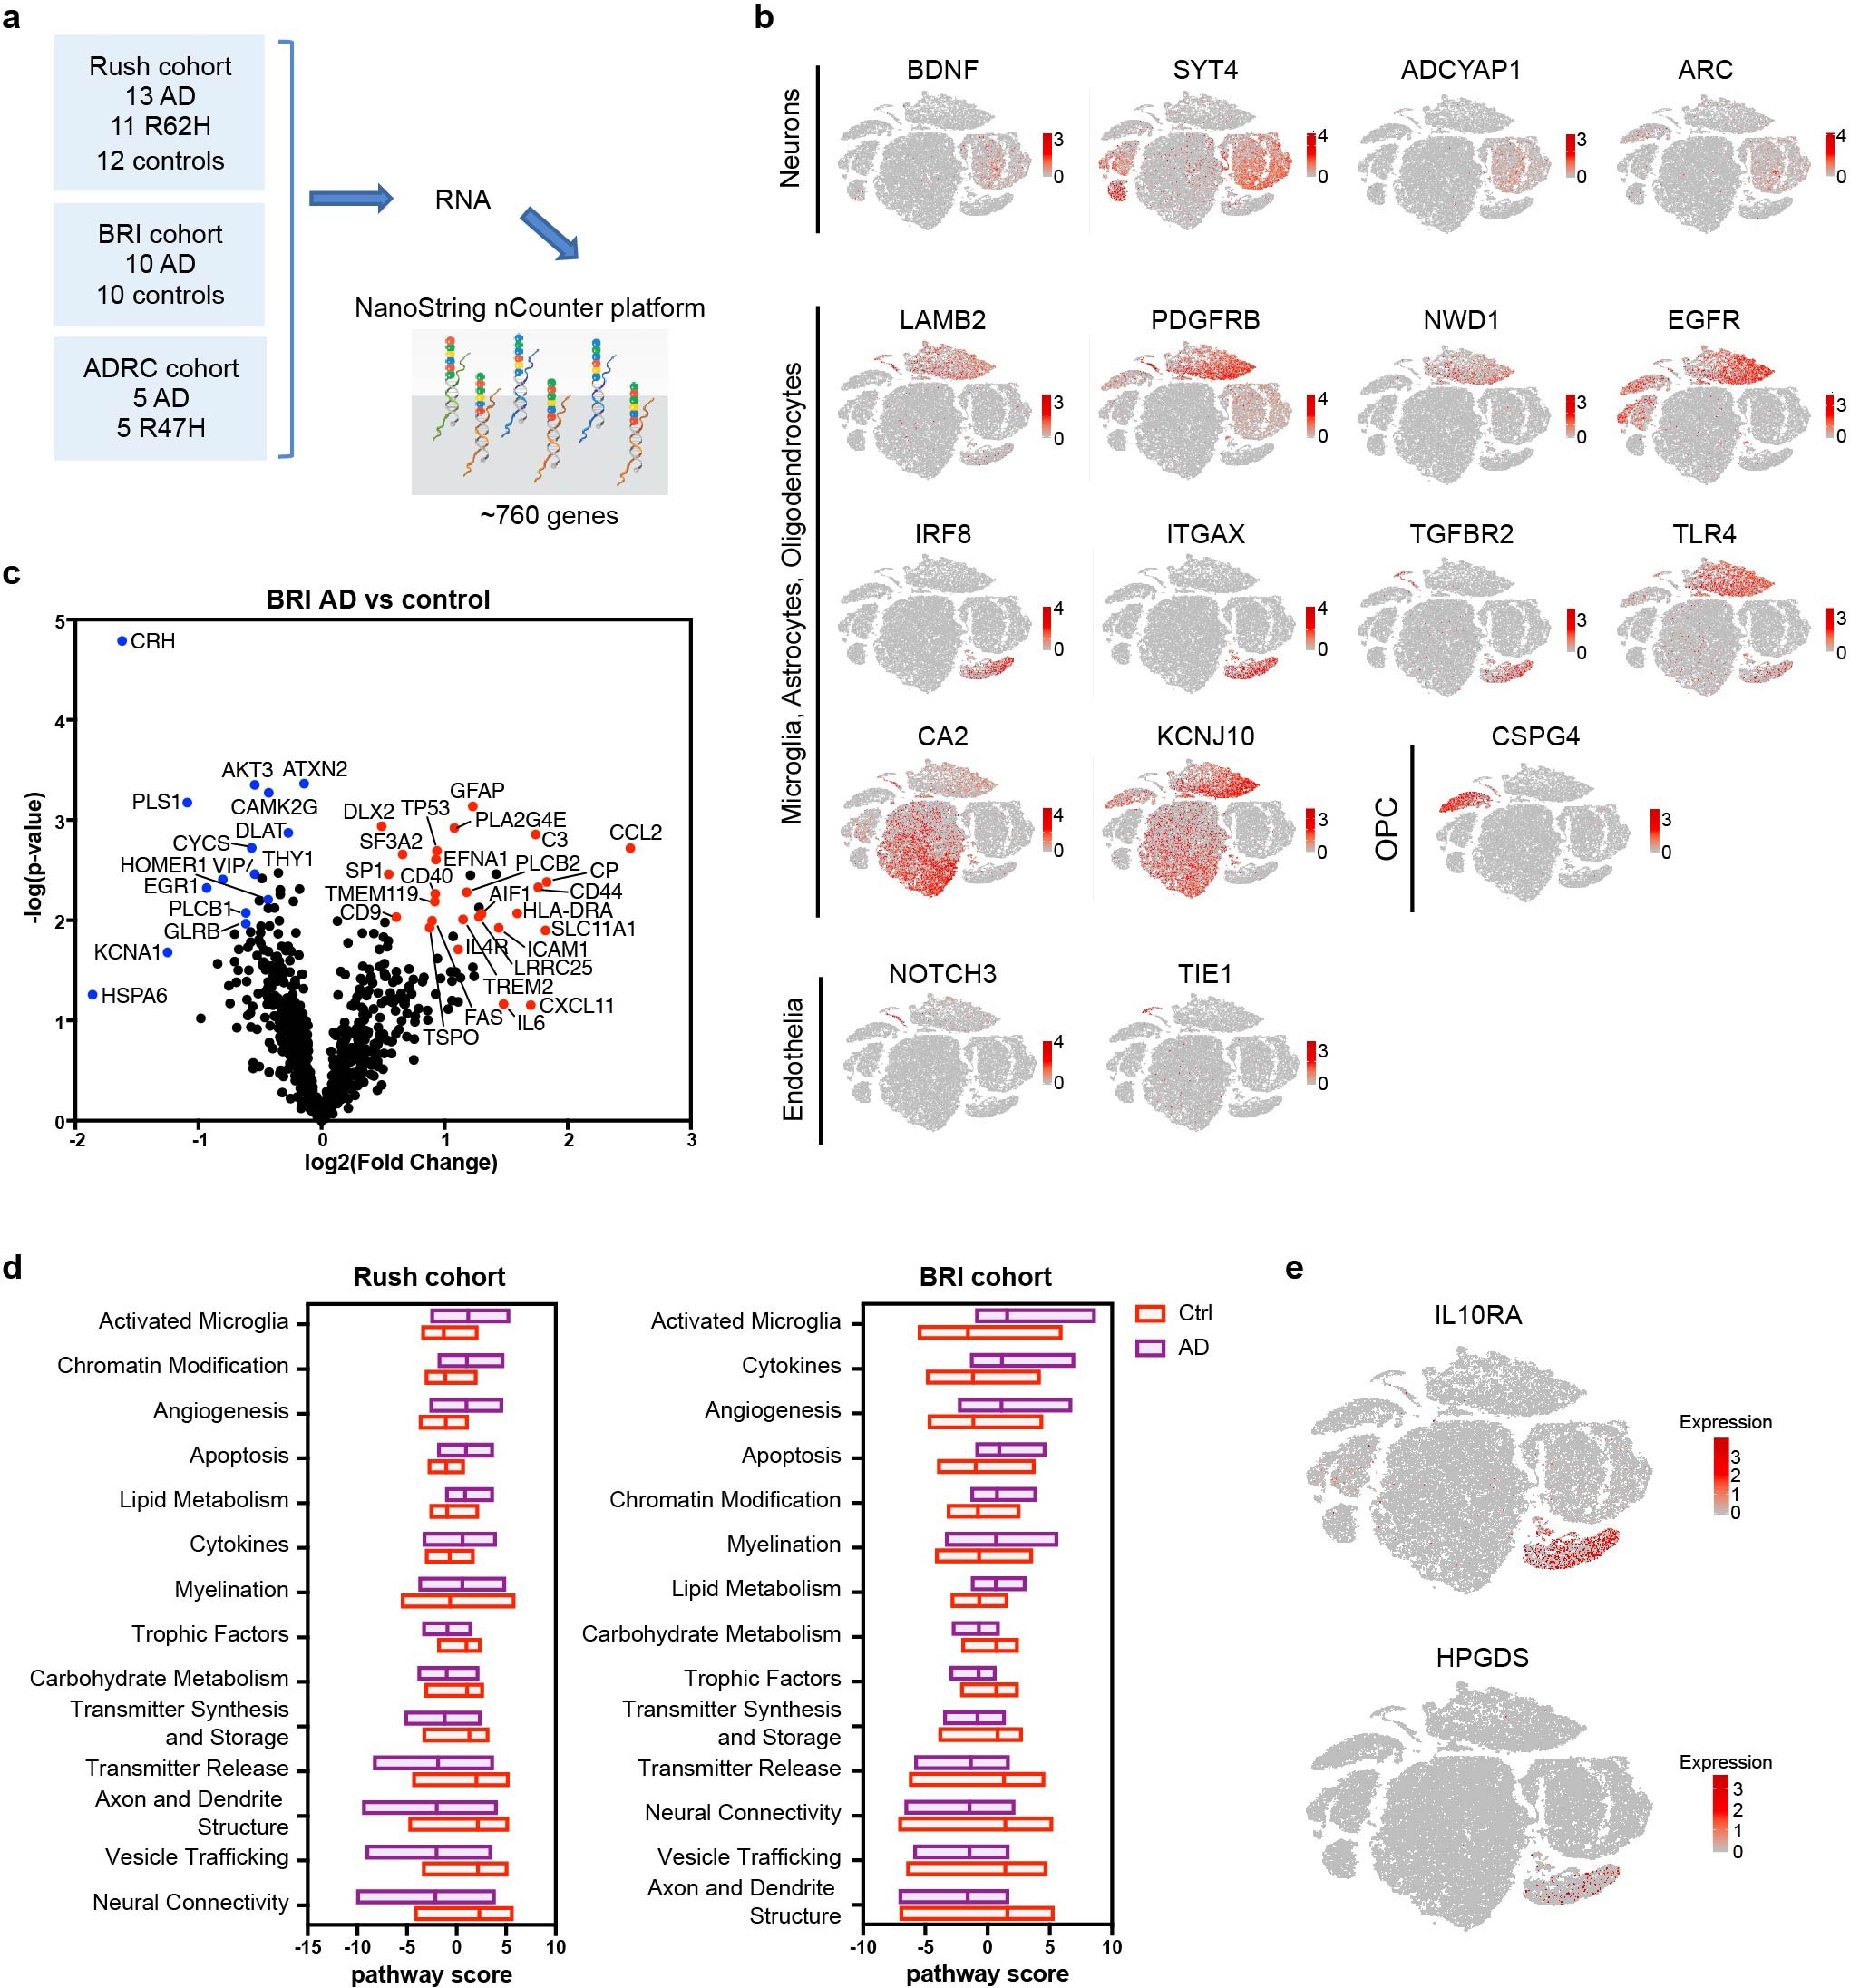
a, Diagram of NanoString pipeline. b, t-SNE plots of human brain showing the cell type of origin of top DEGs identified in NanoString analysis of Rush cohort. Color scheme shows expression. n = 66,311 total nuclei shown. c, Volcano plot showing DEGs of AD versus control from the BRI cohort. n = 10 controls and 10 subjects with AD. P value by multivariate linear regression with Benjamini–Yekutieli adjustment. d, Pathway analysis showing the same pathways are differentially regulated in AD brains from Rush (left) and BRI (right). e, t-SNE plots showing expression of IL10RA and HPGDS in human microglia. n = 66,311 total nuclei shown.
ref