
Abstract
The lateral hypothalamic area (LHA) coordinates an array of fundamental behaviors, including sleeping, waking, feeding, stress and motivated behavior. The wide spectrum of functions ascribed to the LHA may be explained by a heterogeneous population of neurons, the full diversity of which is poorly understood. We employed a droplet-based single-cell RNA-sequencing approach to develop a comprehensive census of molecularly distinct cell types in the mouse LHA. Neuronal populations were classified based on fast neurotransmitter phenotype and expression of neuropeptides, transcription factors and synaptic proteins, among other gene categories. We define 15 distinct populations of glutamatergic neurons and 15 of GABAergic neurons, including known and novel cell types. We further characterize a novel population of somatostatin-expressing neurons through anatomical and behavioral approaches, identifying a role for these neurons in specific forms of innate locomotor behavior. This study lays the groundwork for better understanding the circuit-level underpinnings of LHA function.
Methods
For filtering and unsupervised clustering, the gene expression matrix from Cell Ranger was used for downstream analysis (using Python 2.7.8 and R 3.3.1).
Of the initial 7,218 cells (3,784 male and 3,434 female), 89 cells with less than 500UMIs or >40% of mitochondrial reads were discarded. Genes with at least 2 counts in 5 cells were used for downstream analysis.
Gene expression of the remaining 7,129 cells was normalized by the total number of transcripts detected in each cell and multiplied by the median transcript count. The normalized expression was log2-transformed after an addition of a pseudocount.
The top 1,000 genes with the most variance were identified based on their mean expression in the population and dispersion (variance/mean expression). Genes were binned into 50 different bins based on their mean expression and dispersion scaled with respect to the median dispersion in each bin.
These genes were used to reduce the dimensions of the dataset using Barnes Hut t-SNE with default parameters.
Cells were clustered in t-SNE space using DBSCAN. In each case, this was through an iterative process, testing different parameters and visualizing ellipse thresholds to ensure that clusters were optimally resolved into distinct units in t-SNE space. In the case of male and female samples, both sexes were combined for the analysis. The calculation for the top 1,000 genes, dimensionality reduction and clustering were performed on a combined gene expression matrix, which led to a single representation of cells in t-SNE space.
To differentiate neuronal and non-neuronal clusters, the entire gene vs cell matrix was filtered and clustered as described above. This identified 20 initial clusters.
To classify a cluster as a neuron or a non-neuron cluster, we aggregated the median expression of the known neuron markers Snap25, Syp, Tubb3 and Elavl2 for each cluster. We aggregated the median expression of these genes in each cluster and classified a cluster as high (neuronal) or low (non-neuronal) expression using a simple Gaussian mixture model. Every cell was then classified as a neuron or non-neuron based on their cluster membership. A total of 185 cells were discarded as they were present in clusters classified as both neuronal and non-neuronal.
Subsequent clustering of non-neuronal and neuronal populations was based on this classification. For classification of GABAergic and glutamatergic clusters, clusters classified as neurons were combined and re-clustered as described above, which yielded 30 clusters. Clusters were classified as GABAergic if the median expression of Slc32a1 is greater than Slc17a6 in each cluster and glutamatergic if the median expression of Slc17a6 is greater than Slc32a1. A total of 803 cells were discarded in this step, as they were unassigned to any of the 30 clusters or there was no difference in the median expression of Slc17a6 and Slc32a1. Furthermore, 17 cells were unassigned to non-neuronal clusters, 80 cells were unassigned to glutamatergic clusters and 71 cells were unassigned to GABAergic clusters.
Marker genes were identified using area under a receiver operating characteristic curve (AUROC) analysis. All genes that are greater than twofold expressed in the cluster compared with the rest of the population were analyzed using AUROC. Genes that had greater than 85% classification score were defined as markers specific to the cell type. Genes differentially expressed in a given cluster were computed using edgeR.
Expression of marker genes in each cluster were represented as violin plots. Violin plots were rendered using the ggplot2 package in R. They represent the distribution of log-transformed normalized gene expression (gene UMIs/total cell UMIs) in each cluster.
The maximum expression for each of violin plot was set to 5. Marker genes were used for provisional cluster names that included one to three markers. A cluster name denoted by a single marker indicates a gene that is selectively and robustly expressed by a single cluster and is sufficient to define that cluster. The addition of a second marker indicates a secondary identifier that is also strongly, although not necessarily uniquely, expressed in the cluster. Gad1 was added to the four LHAGlut clusters that robustly expressed it, despite being classified as glutamatergic. Finally, we found that although Pmch and Hcrt expression was sufficient to identify LHAGlut clusters 1 and 6, respectively, they were unique in also being expressed at low, but consistent, levels in every other LHAGlut and LHAGABA cluster. This is likely explained by ambient mRNA released from damaged neurons during dissociation.
Figure
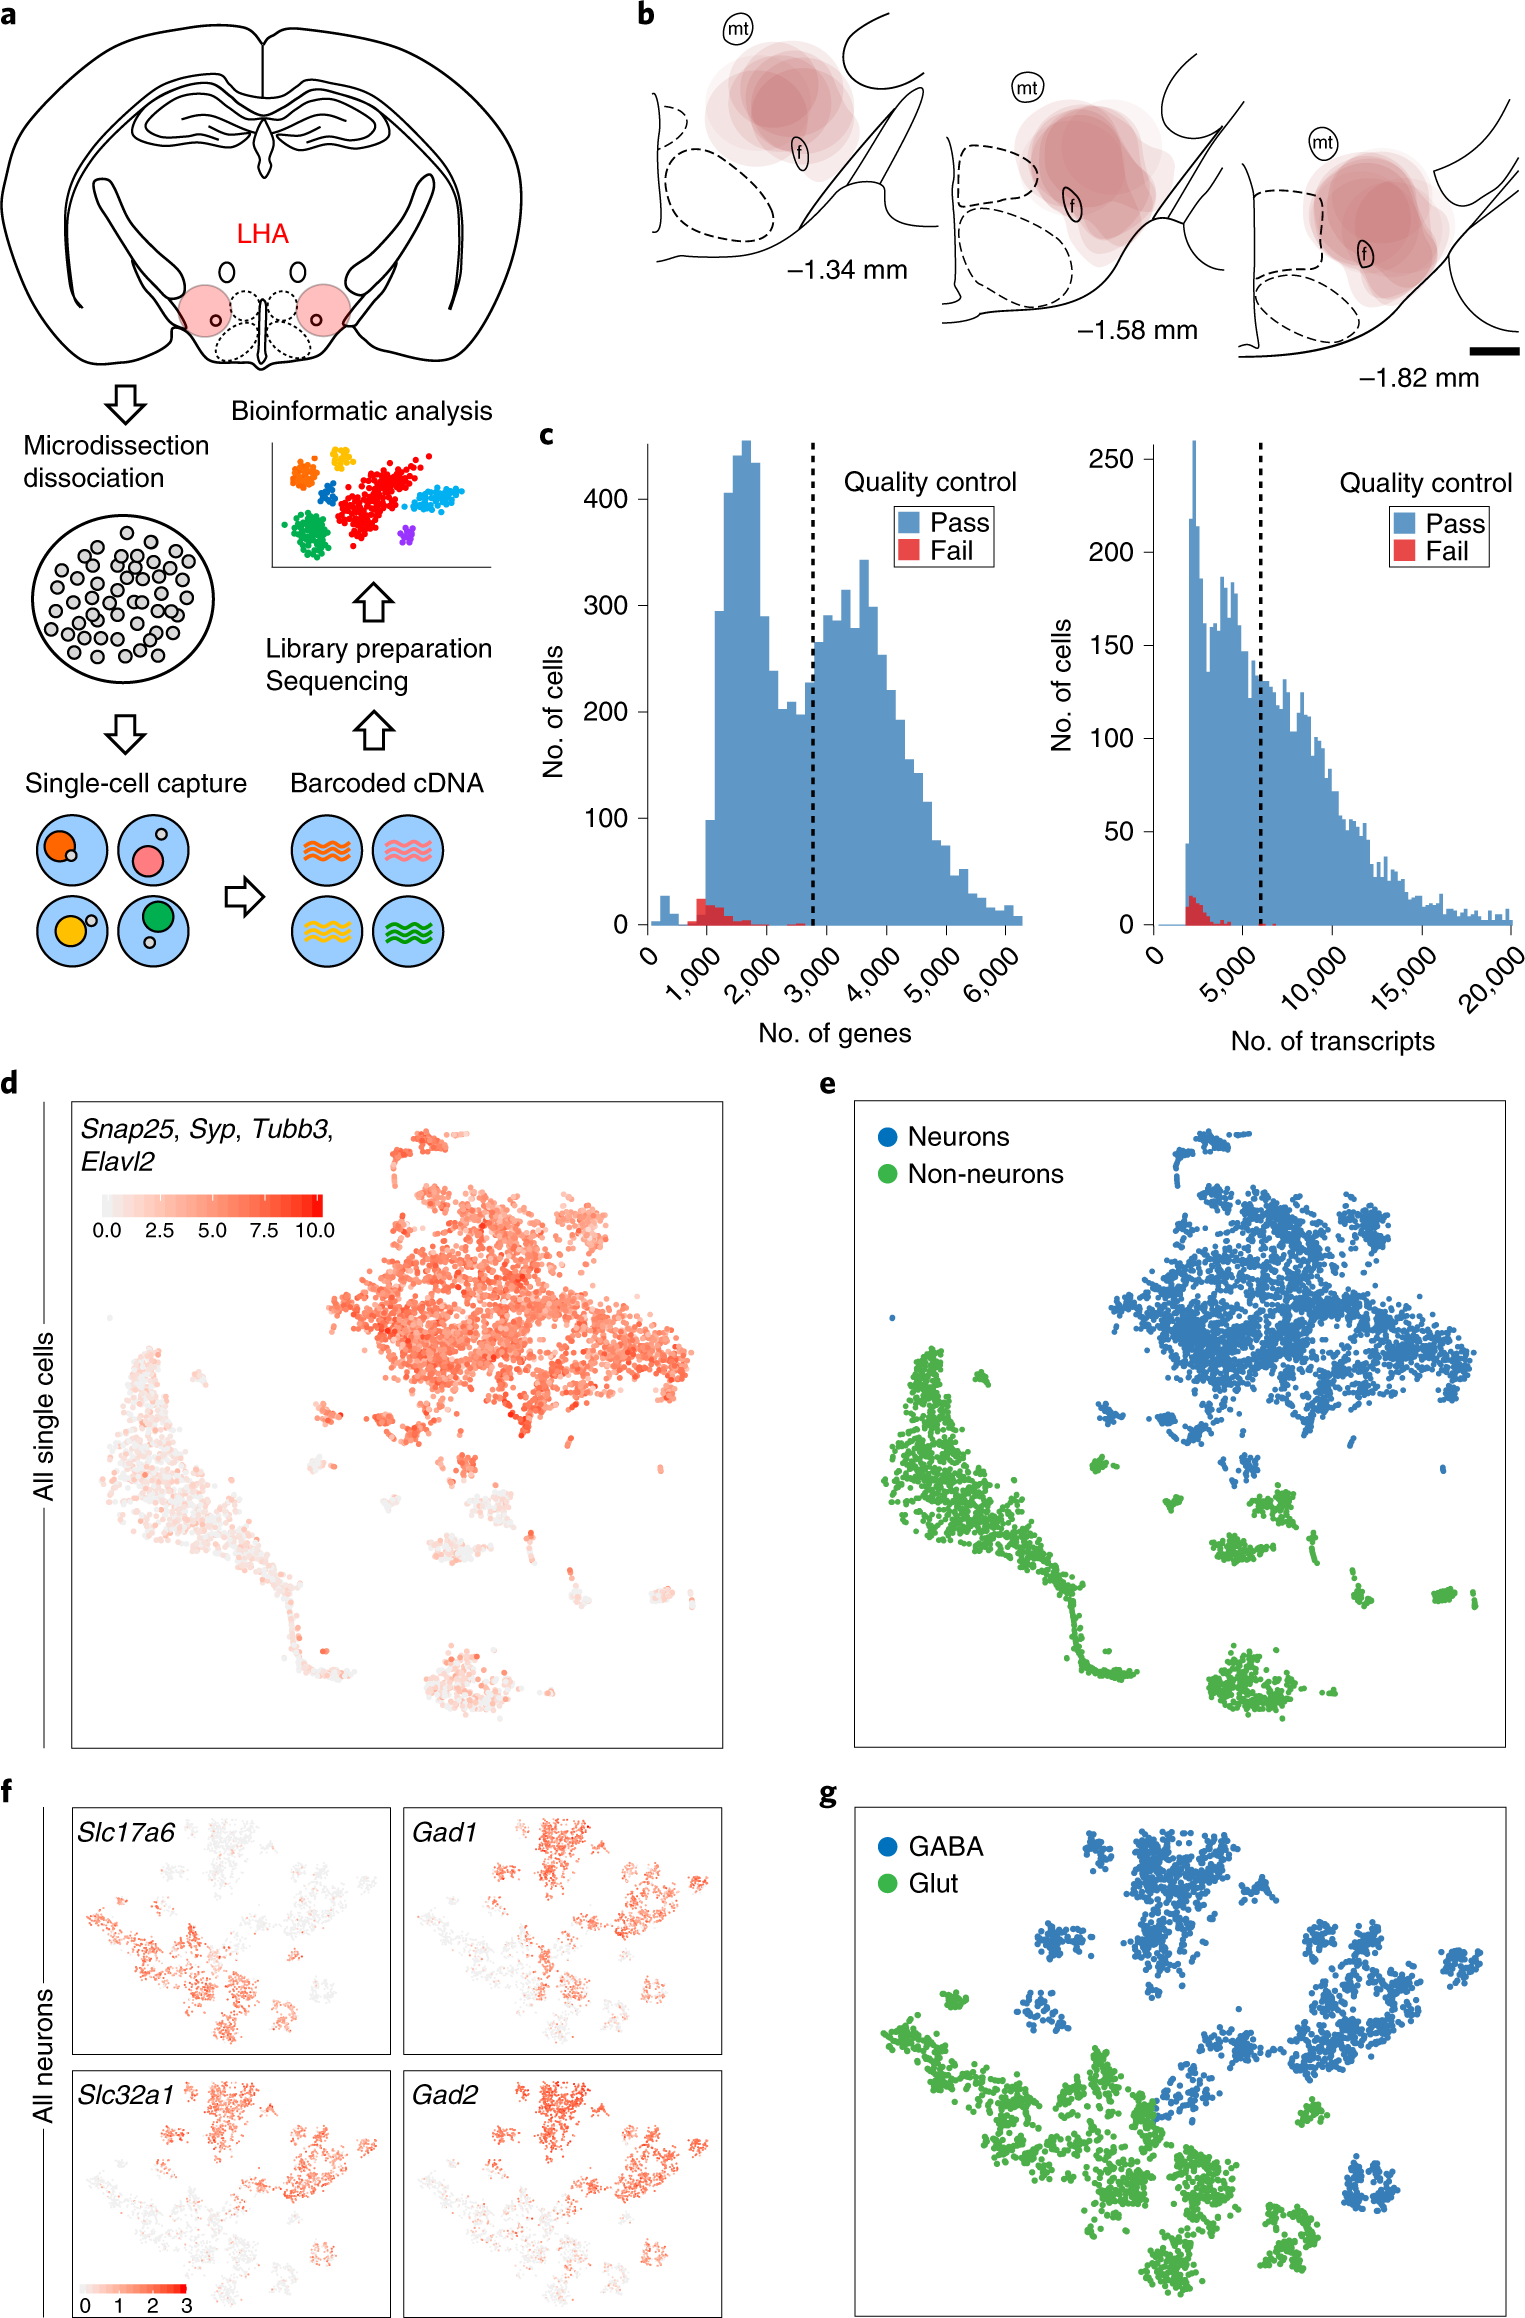
Fig. 1: scRNA-seq of LHA cell populations.

a, Schematic representation of the workflow for LHA microdissection, single-cell isolation, cDNA library preparation, sequencing and clustering. b, Location of LHA microdissections from male and female C57BL/6 mice, mapped onto coronal mouse brain atlas images corresponding to distances from bregma of −1.34, −1.58 and −1.82 mm. mt, mammillothalamic tract; f, fornix. Scale bar, 500 μm. c, Histograms of genes and transcripts (UMIs) detected in 7,129 single cells. d, Sum of normalized expression of pan-neuronal markers in each cell shown on a t-SNE plot after the first iteration of unsupervised clustering (n = 6,944 cells). e, Cells were classified using a Gaussian mixture model as neurons or non-neurons based on the combined expression of pan-neuronal markers (n = 6,944 cells). f, Normalized expression of Slc17a6, Slc32a1, Gad1 and Gad2 in each cell shown on a t-SNE plot after the second iteration of unsupervised clustering of neuronal cells (n = 3,589 cells in each panel). g, Neurons were classified as either GABAergic or glutamatergic based on the expression of Slc32a1 and Slc17a6, respectively (n = 3,589 cells).
Fig. 2: Classification of LHAGlut and LHAGABA neuronal cell types in the LHA.

a, Unsupervised clustering of LHAGlut neuronal cell types represented in a t-SNE plot (n = 1,537 cells). Cell-type clusters are color coded, with classifications below the plot. b, Violin plot, representing the distribution of log-transformed normalized gene expression (gene UMIs/total cell UMIs) in each cluster, of the pan-neuronal marker Snap25, neurotransmitter components (Slc32a1, Gad1, Gad2 and Slc17a6) (upper) and discriminatory markers (lower) for LHAGlut neuronal cell types (n = 1,537 cells). c, Unsupervised clustering of LHAGABA neuronal cell types represented in a t-SNE plot (n = 1,900 cells). Different cell-type clusters are color coded, with classifications below the plot. d, Violin plot showing normalized expression of neuronal, neurotransmitter (upper) and discriminatory markers (lower) for LHAGABA neuronal cell types (n = 1,900 cells). Total number of cells per cluster, mean genes per cell and mean UMIs per cell are provided in Supplementary Table 1.
Fig. 3: Validation of discriminatory marker expression in LHAGlut Hcrt-expressing neurons.

a, Violin plot, representing the distribution of log-transformed normalized gene expression (gene UMIs/total cell UMIs), of Slc32a1, Slc17a6 and discriminatory markers of LHAGlut cluster 6 (Hcrt) neurons (n = 162 cells). Total number of cells, mean genes per cell and mean UMIs per cell are provided in Supplementary Table 1. b, Left: heatmap of 100 single Hcrt+ neurons and their expression of 30 genes by qPCR (n = 11 mice). Heatmap colors depict expression levels on a log2 scale from low (blue) to high (red). Right: bar graph measuring percentage expression for seven genes in single Hcrt+ neurons. c, Confocal micrographs (×40) of coronal sections of wild-type mice and corresponding pie charts representing co-expression of mRNA for Hcrt and Rfx4 (n = 675 cells, 4 mice; upper), Hcrt and Nptx2 (n = 203 cells, 4 mice; middle), and Hcrt and Pcsk1 (n = 675 cells, 3 mice; lower). All sections were counterstained with DAPI (blue). White arrowheads indicate co-localization. Scale bar (applicable to all micrographs), 50 μm.
Fig. 4: Validation of discriminatory marker expression in LHAGlut Pmch-expressing neurons and subpopulations.
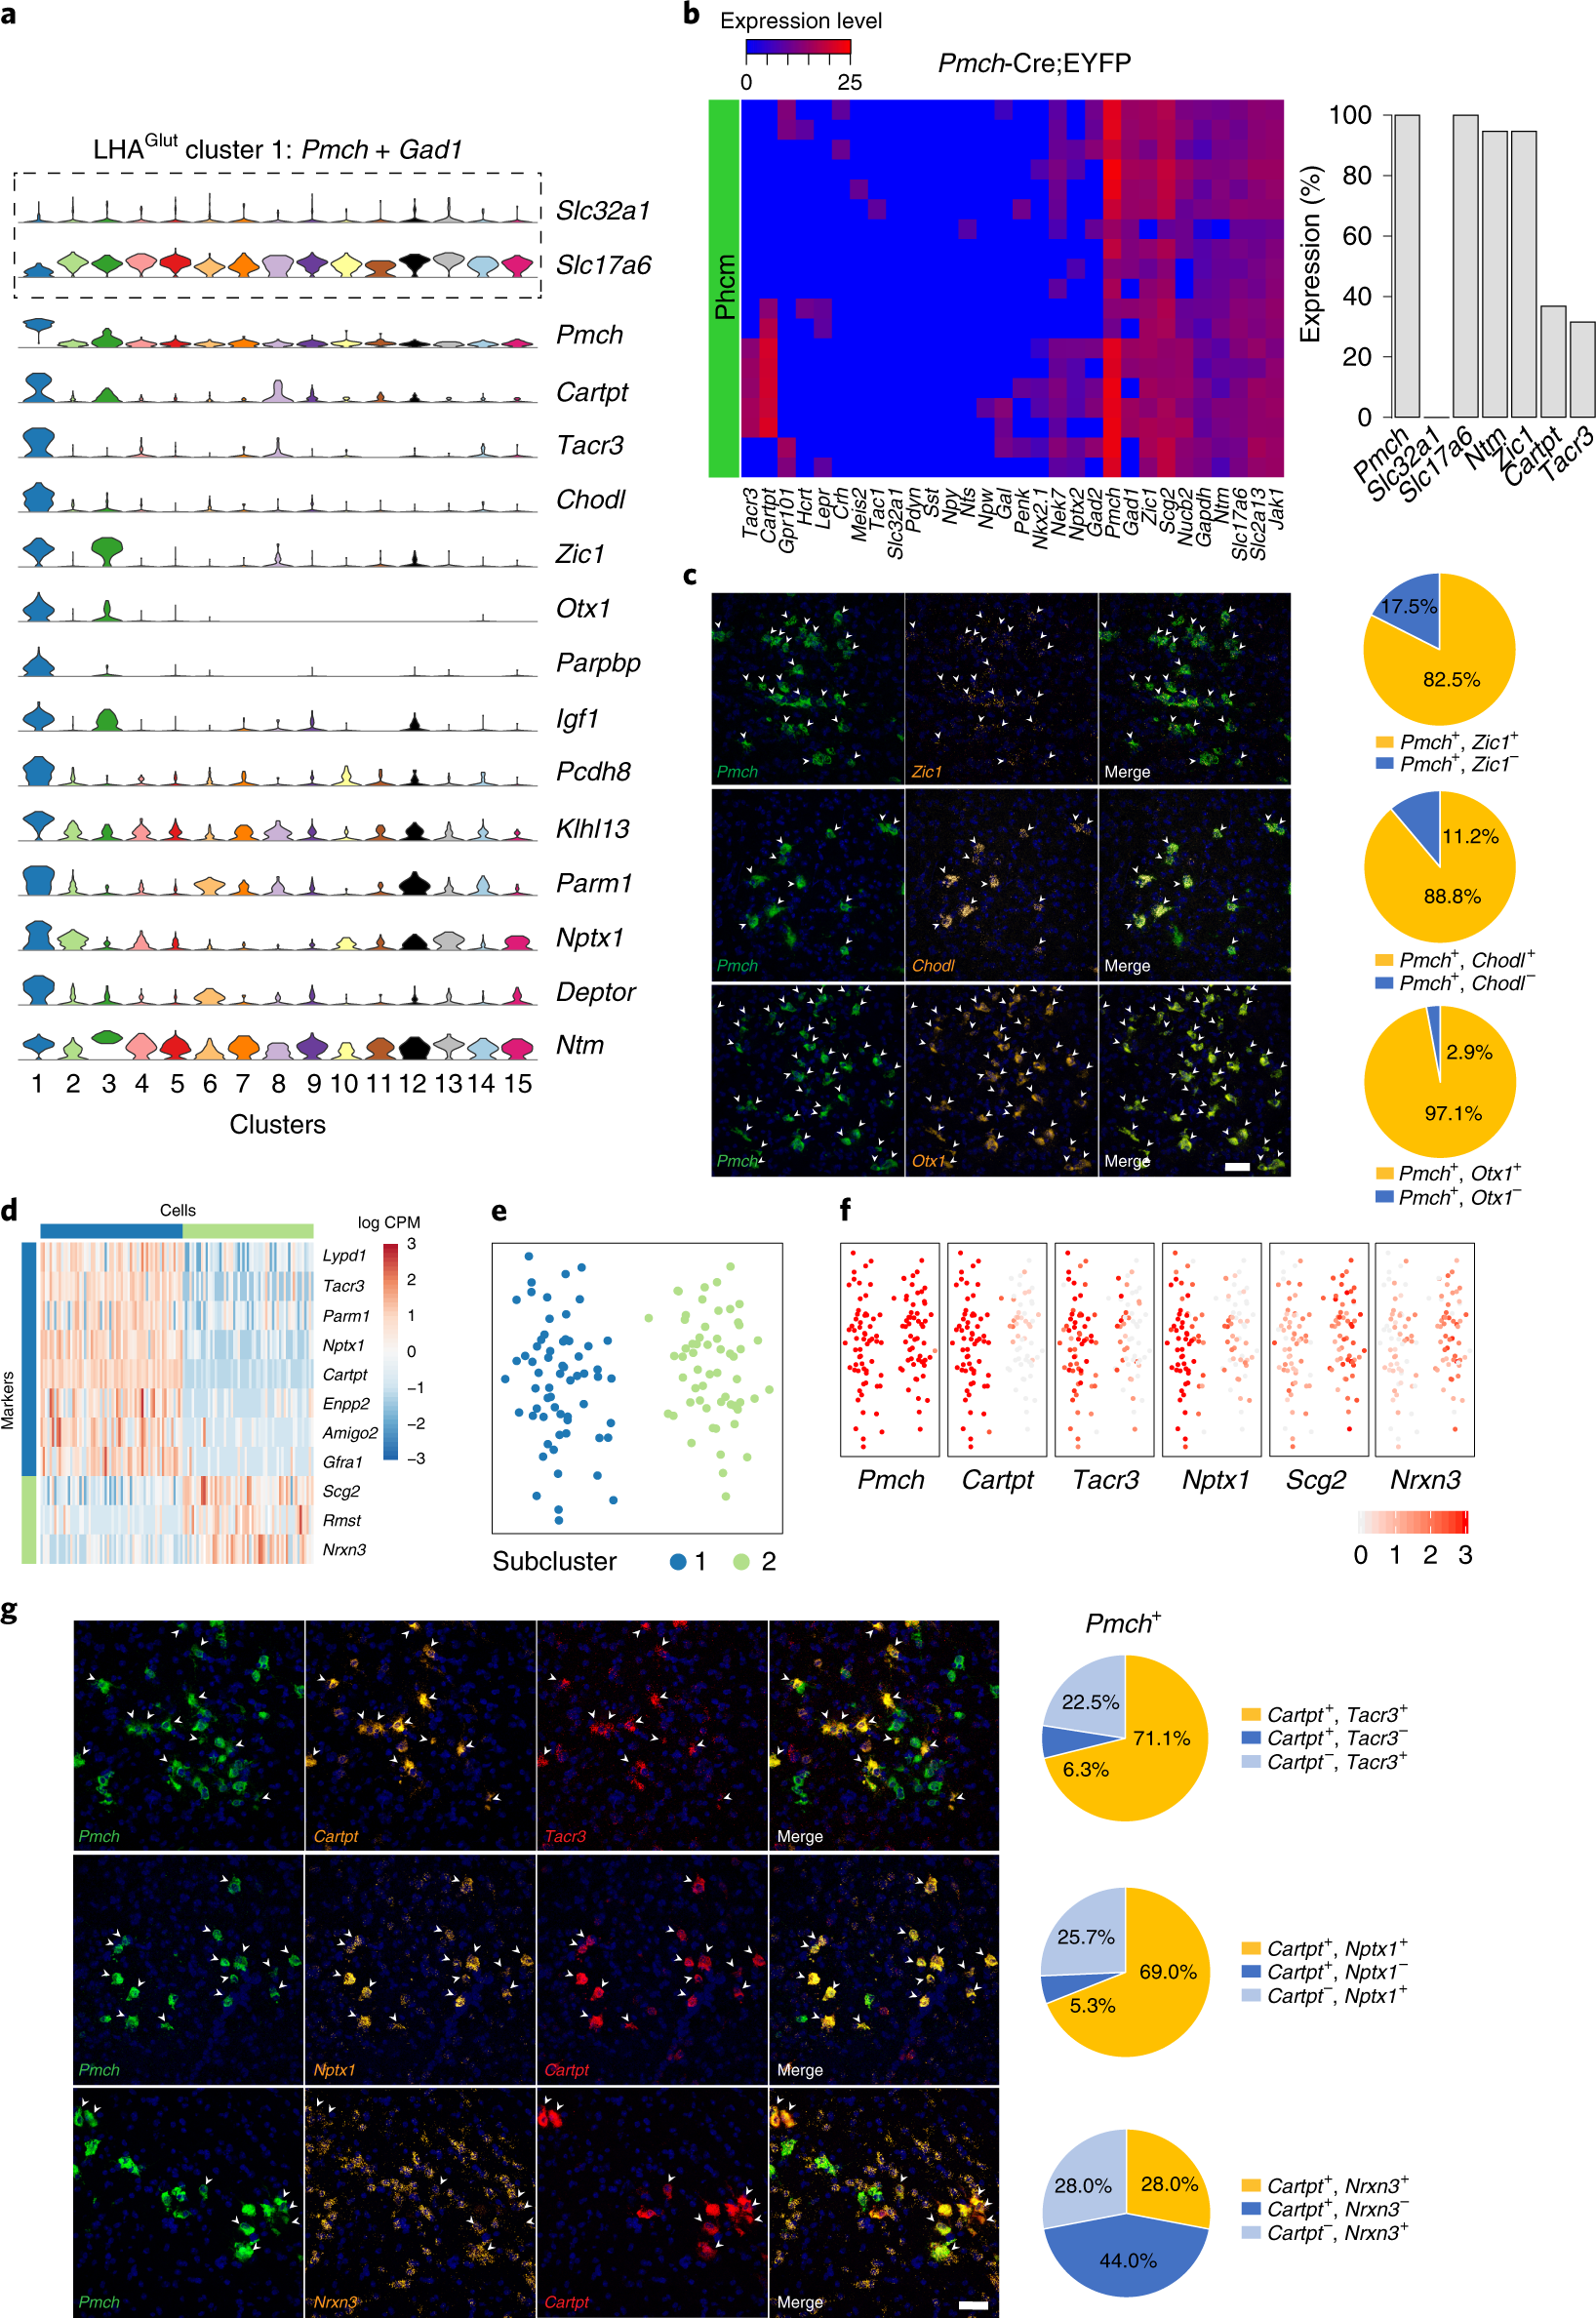
a, Violin plot, representing the distribution of log-transformed normalized gene expression (gene UMIs/total cell UMIs), of Slc32a1, Slc17a6 and discriminatory markers of LHAGlut cluster 1 (Pmch with Gad1) neurons (n = 119 cells). Total number of cells, mean genes per cell and mean UMIs per cell are provided in Supplementary Table 1. b, Left: heatmap of 19 single Pmch+ neurons and their expression of 30 genes by qPCR (n = 3 mice). Heatmap colors depict expression levels on a log2 scale from low (blue) to high (red). Right: bar graph measuring percentage expression for seven genes in single Pmch+ neurons. c, Confocal micrographs (×40) of coronal sections of wild-type mice and corresponding pie charts representing co-expression of mRNA for Pmch and Zic1 (n = 251 cells, 4 mice; upper), Pmch and Chodl (n = 206 cells, 3 mice; middle), and Pmch and Otx1 (n = 748 cells, 3 mice; lower). d, Heatmap showing scaled expression (log counts per million (CPM)) of discriminative genes across the two Pmch+ subclusters. e, Unsupervised clustering of Pmch+ neurons of the LHA represented as a t-SNE plot (n = 119 cells), showing subclusters 1 (blue) and 2 (green). f, Normalized expression of discriminatory markers shown as t-SNE plots (Pmch, Cartpt, Tacr3, Nptx1, Scg2 and Nrxn3) (n = 119 cells). g, Confocal micrographs (×40) of coronal sections of wild-type mice and corresponding pie charts representing co-expression of mRNA for Pmch, Cartpt and Tacr3 (n = 283 cells, 3 mice; upper), Pmch, Nptx1 and Cartpt (n = 261 cells, 3 mice; middle), and Pmch, Nrxn3 and Cartpt (n = 309 cells, 3 mice; upper). For c and g, all sections were counterstained with DAPI (blue), and white arrowheads indicate co-localization. Scale bar (applicable to all micrographs), 50 μm.
Fig. 5: Validation of discriminatory marker expression in LHAGlut Trh-expressing neurons and subpopulations.

a, Violin plot, representing the distribution of log-transformed normalized gene expression (gene UMIs/total cell UMIs), of Slc32a1, Slc17a6 and discriminatory markers of LHAGlut clusters 8 and 12 (Trh with X) neurons (n = 131 cells). Total number of cells, mean genes per cell and mean UMIs per cell are shown in Supplementary Table 1. b, Confocal micrographs (×40) of coronal sections of wild-type mice and corresponding pie charts representing co-expression of mRNA for Trh and Slc17a6 (n = 299 cells, 3 mice; upper), Trh and Otp (n = 732 cells, 4 mice; middle), and Trh and Onecut2 (n = 274 cells, 3 mice; lower). White arrowheads indicate co-localization. c, Heatmap showing scaled expression (log CPM) of discriminative genes across the two Trh+ clusters. d, Unsupervised clustering of LHA Trh+ neurons represented as a t-SNE plot (n = 131 cells), showing clusters 8 (blue) and cluster 12 (green). e, Normalized expression of discriminatory markers shown as t-SNE plots (Trh, Cbln2, Gpr101, Syt2 and Cplx1) (n = 131 cells). f, Confocal micrographs (×40) of coronal sections of wild-type mice and corresponding pie chart representing the co-expression of mRNA for Trh, Syt2 and Cbln2 (n = 1177 cells, 4 mice). All sections were counterstained with DAPI (blue), and white arrowheads indicate co-localization of Trh and Syt2 and white asterisks indicate co-localization of Trh and Cbln2. Scale bar (applicable to all micrographs), 50 μm.
Fig. 6: Validation of discriminatory marker expression in LHAGABA Nts-expressing neurons and subpopulations.
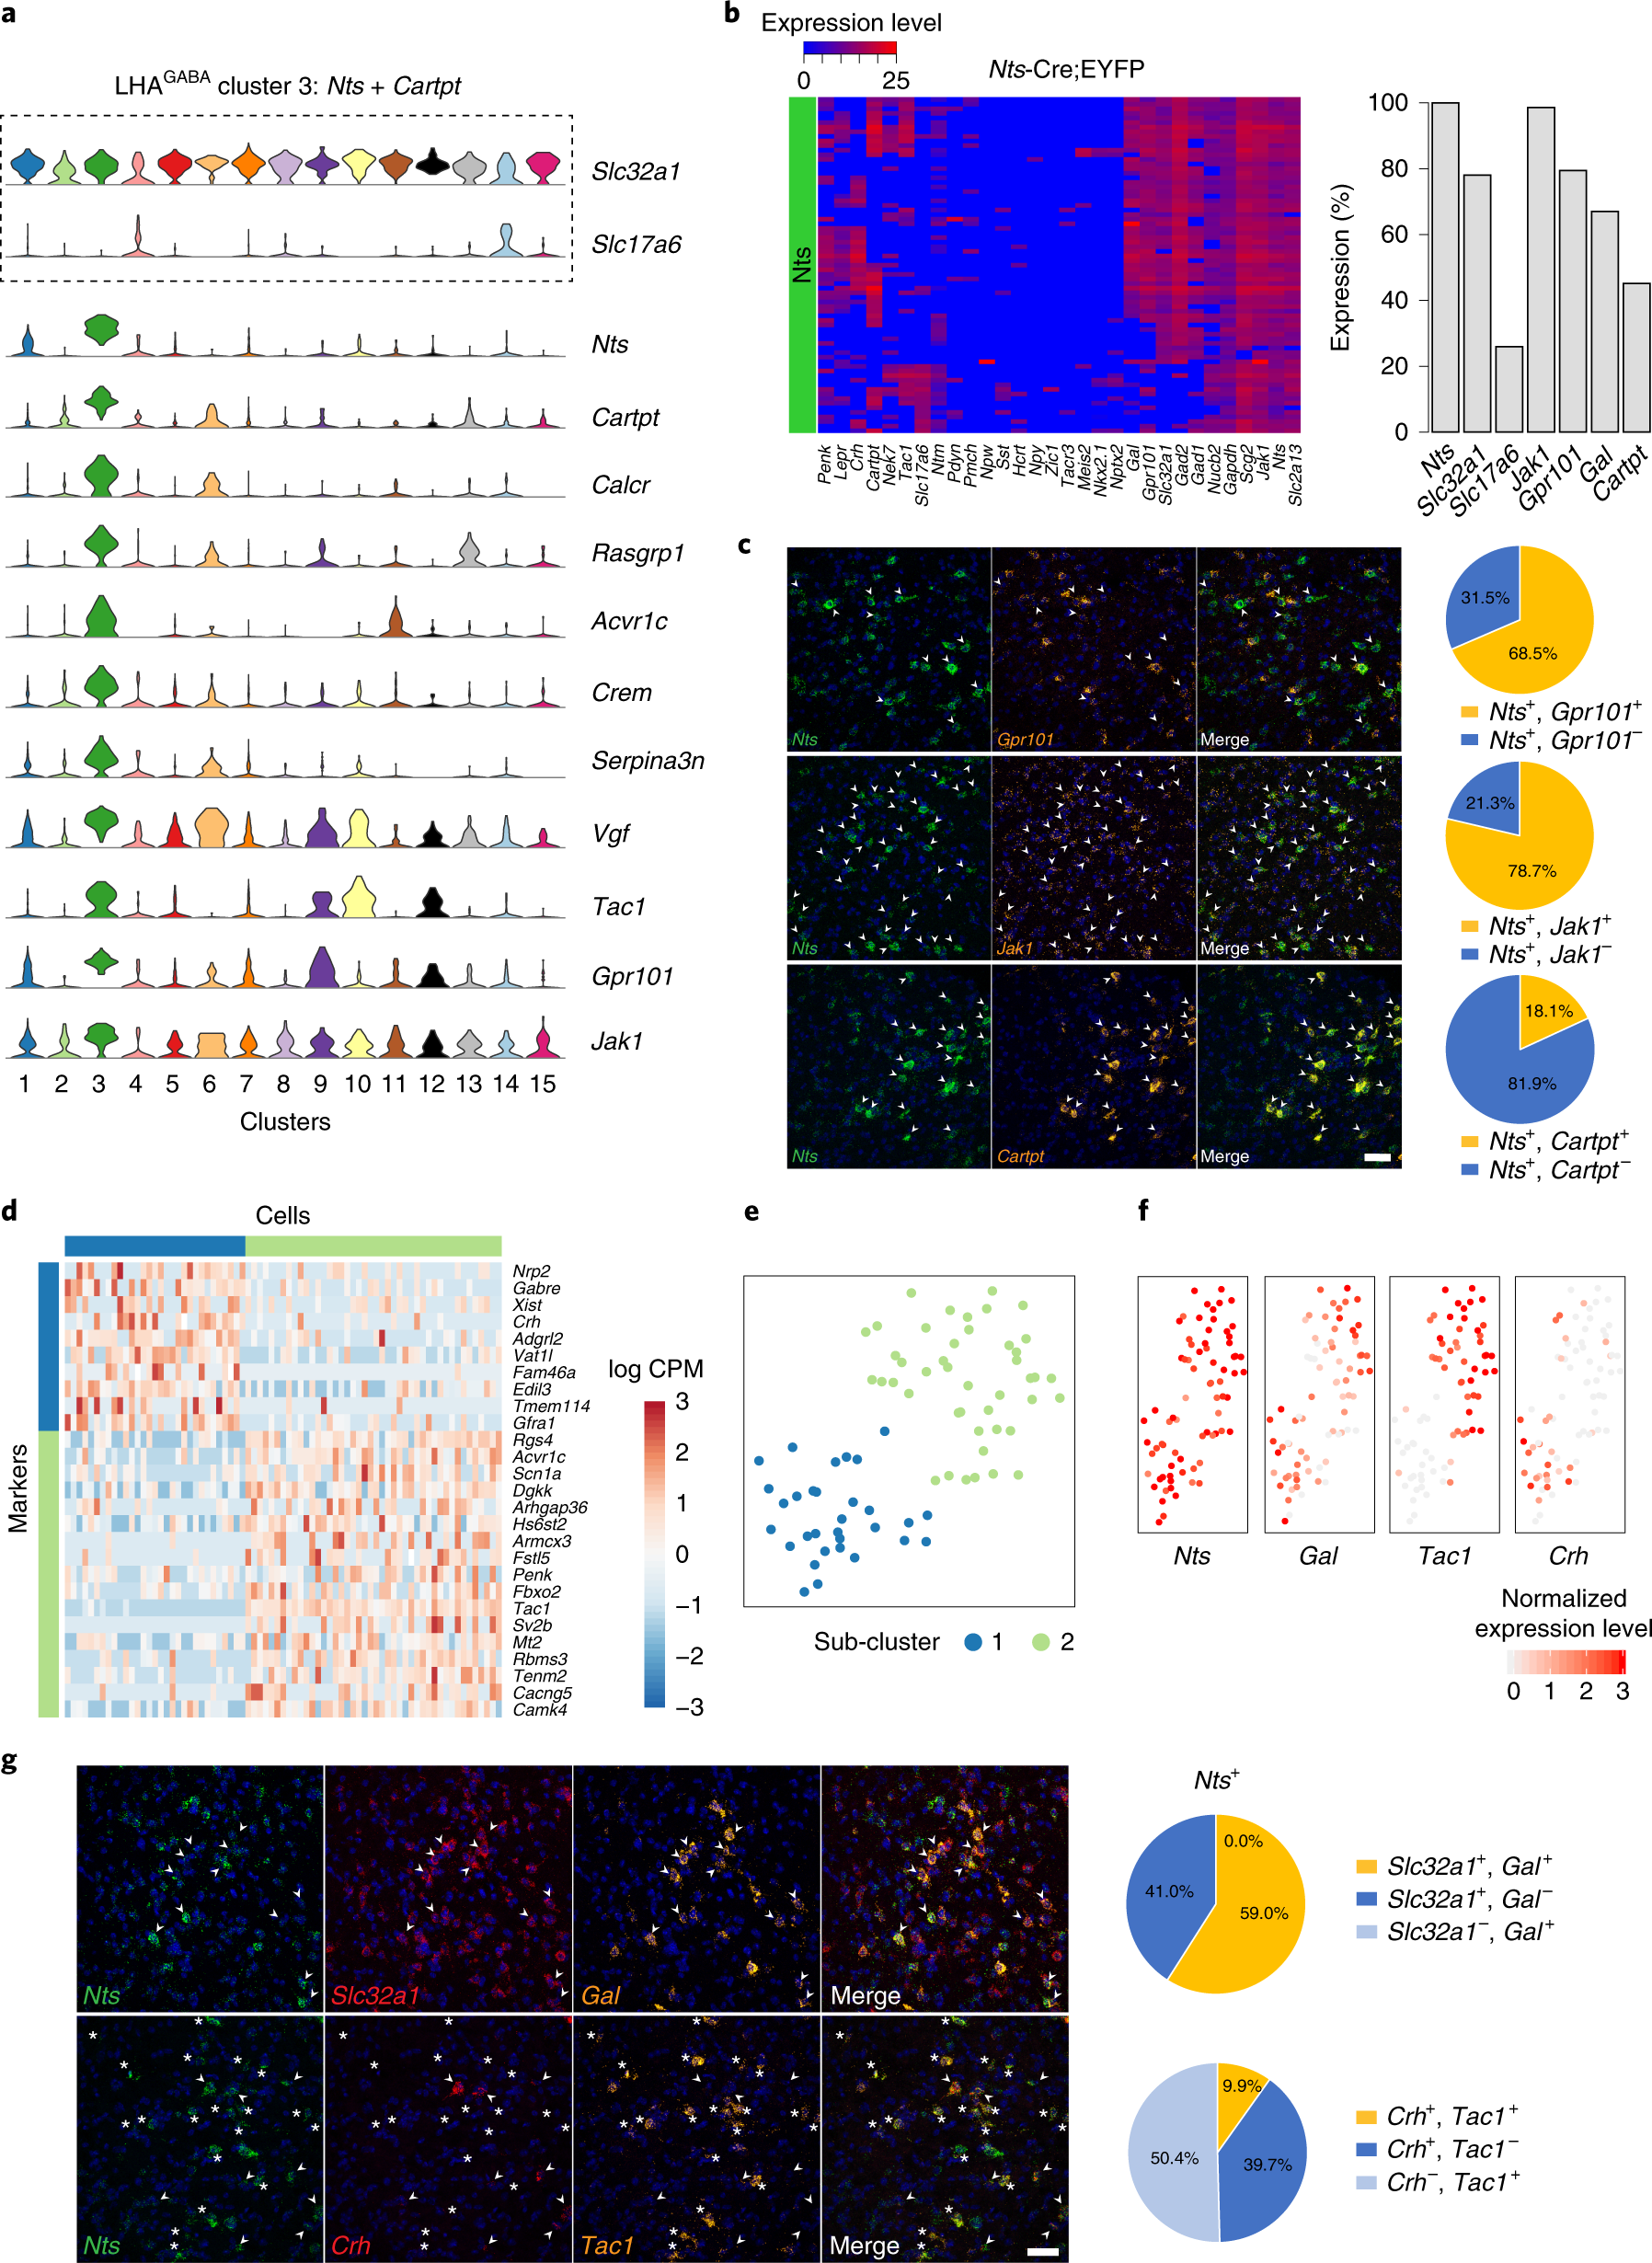
a, Violin plot, representing the distribution of log-transformed normalized gene expression (gene UMIs/total cell UMIs), of Slc32a1, Slc17a6 and discriminatory markers of LHAGABA cluster 3 (Nts with Cartpt) neurons (n = 75 cells). Total number of cells, mean genes per cell and mean UMIs per cell are shown in Supplementary Table 1. b, Left: heatmap of 73 single Nts+ neurons and their expression of 30 genes by qPCR (n = 3 mice). Heatmap colors depict expression levels on a log2 scale from low (blue) to high (red). Right: bar graph measuring percentage expression for seven genes in Nts+ single neurons. c, Confocal micrographs (×40) of coronal sections of wild-type mice and corresponding pie charts representing co-expression of mRNA for Nts and Gpr101 (n = 553 cells, 3 mice; upper), Nts and Jak1 (n = 361 cells, 3 mice; middle), Nts and Cartpt (n = 408 cells, 3 mice; lower). All sections were counterstained with DAPI (blue). White arrowheads indicate co-localization. Scale bar (applicable to all micrographs), 50 μm. d, Heatmap showing scaled expression (log CPM) of discriminative genes across the two Nts and Cartpt subclusters (n = 74 cells). e, Unsupervised clustering of LHA Nts and Cartpt neurons represented as a t-SNE plot (n = 74 cells), showing subclusters 1 (blue) and 2 (green). f, Normalized expression of discriminatory markers shown as t-SNE plots (Nts, Gal, Tac1 and Crh) (n = 74 cells). g, Confocal micrographs (×40) of coronal sections of wild-type mice and corresponding pie charts representing co-expression of mRNA for Nts, Slc32a1 and Gal (n = 308 cells, 3 mice; upper). White arrowheads indicate co-localization of Nts, Slc32a1 and Gal. Co-expression of Nts, Crh and Tac1 (n = 1,016 cells, 3 mice; lower). White arrowheads indicate co-localization of Nts and Crh, and white asterisks indicate co-localization of Nts and Tac1. All sections were counterstained with DAPI (blue). Scale bar (applicable to all micrographs), 50 μm.
Fig. 7: Defining four molecularly distinct populations of Sst-expressing neurons in the LHA

a, Violin plot, representing the distribution of log-transformed normalized gene expression (gene UMIs/total cell UMIs), of Slc32a1, Slc17a6 and discriminatory markers of LHAGlut cluster 15 (Sst) neurons (n = 40 cells). b, Violin plot showing normalized expression of Slc32a1, Slc17a6 and discriminatory markers of LHAGABA clusters 6 (Sst with Col25a1) (n = 27 cells), 10 (Sst with Meis2) (n = 60 cells) and 13 (Sst with Otp) (n = 70 cells) neurons. Total number of cells, mean genes per cell and mean UMIs per cell are provided in Supplementary Table 1. c, Heatmap showing scaled expression (log CPM) of differentially expressed genes between Sst+ and Slc32a1+ neurons (blue) and Sst+ and Slc17a6+ neurons (pink) (n = 197 cells). d, Heatmap showing scaled expression (log CPM) of differentially expressed genes between the three Sst+ and Slc32a1+ clusters (shades of blue) (n = 157 cells). e, Unsupervised clustering of all Sst+ LHA neurons represented in a t-SNE plot (n = 197 cells). Each cell type cluster is color coded as in c and d. f, Left: heatmap of 87 single Sst+ neurons and their expression of 30 genes by qPCR (n = 3 mice). Heatmap colors depict expression levels on a log2 scale from low (blue) to high (red). Right: bar graph measuring percentage expression for four genes in Sst+ single neurons. g, Anatomical schematic of the perifornical region of the LHA (gray) (upper left). Confocal micrographs (×40) of coronal sections of wild-type mice and corresponding pie charts representing co-expression of mRNA within the perifornical LHA for Sst, Slc32a1 and Slc17a6 (n = 952 cells, 5 mice; upper right). Tuberal region (gray) (lower left). Confocal micrographs (×40) of coronal sections of wild-type mice and corresponding pie charts representing co-expression within the tuberal region for Sst, Slc32a1 and Slc17a6 (n = 1,116 cells, 5 mice; lower right). All sections were counterstained with DAPI (blue). White arrowheads indicate co-localization of Sst and Slc32a1, while white asterisks denote co-localization of Sst and Slc17a6. Scale bar (applicable to all micrographs), 50 μm.
Supplementary Figure 1: Comparison of female and male single-cell LHA samples.
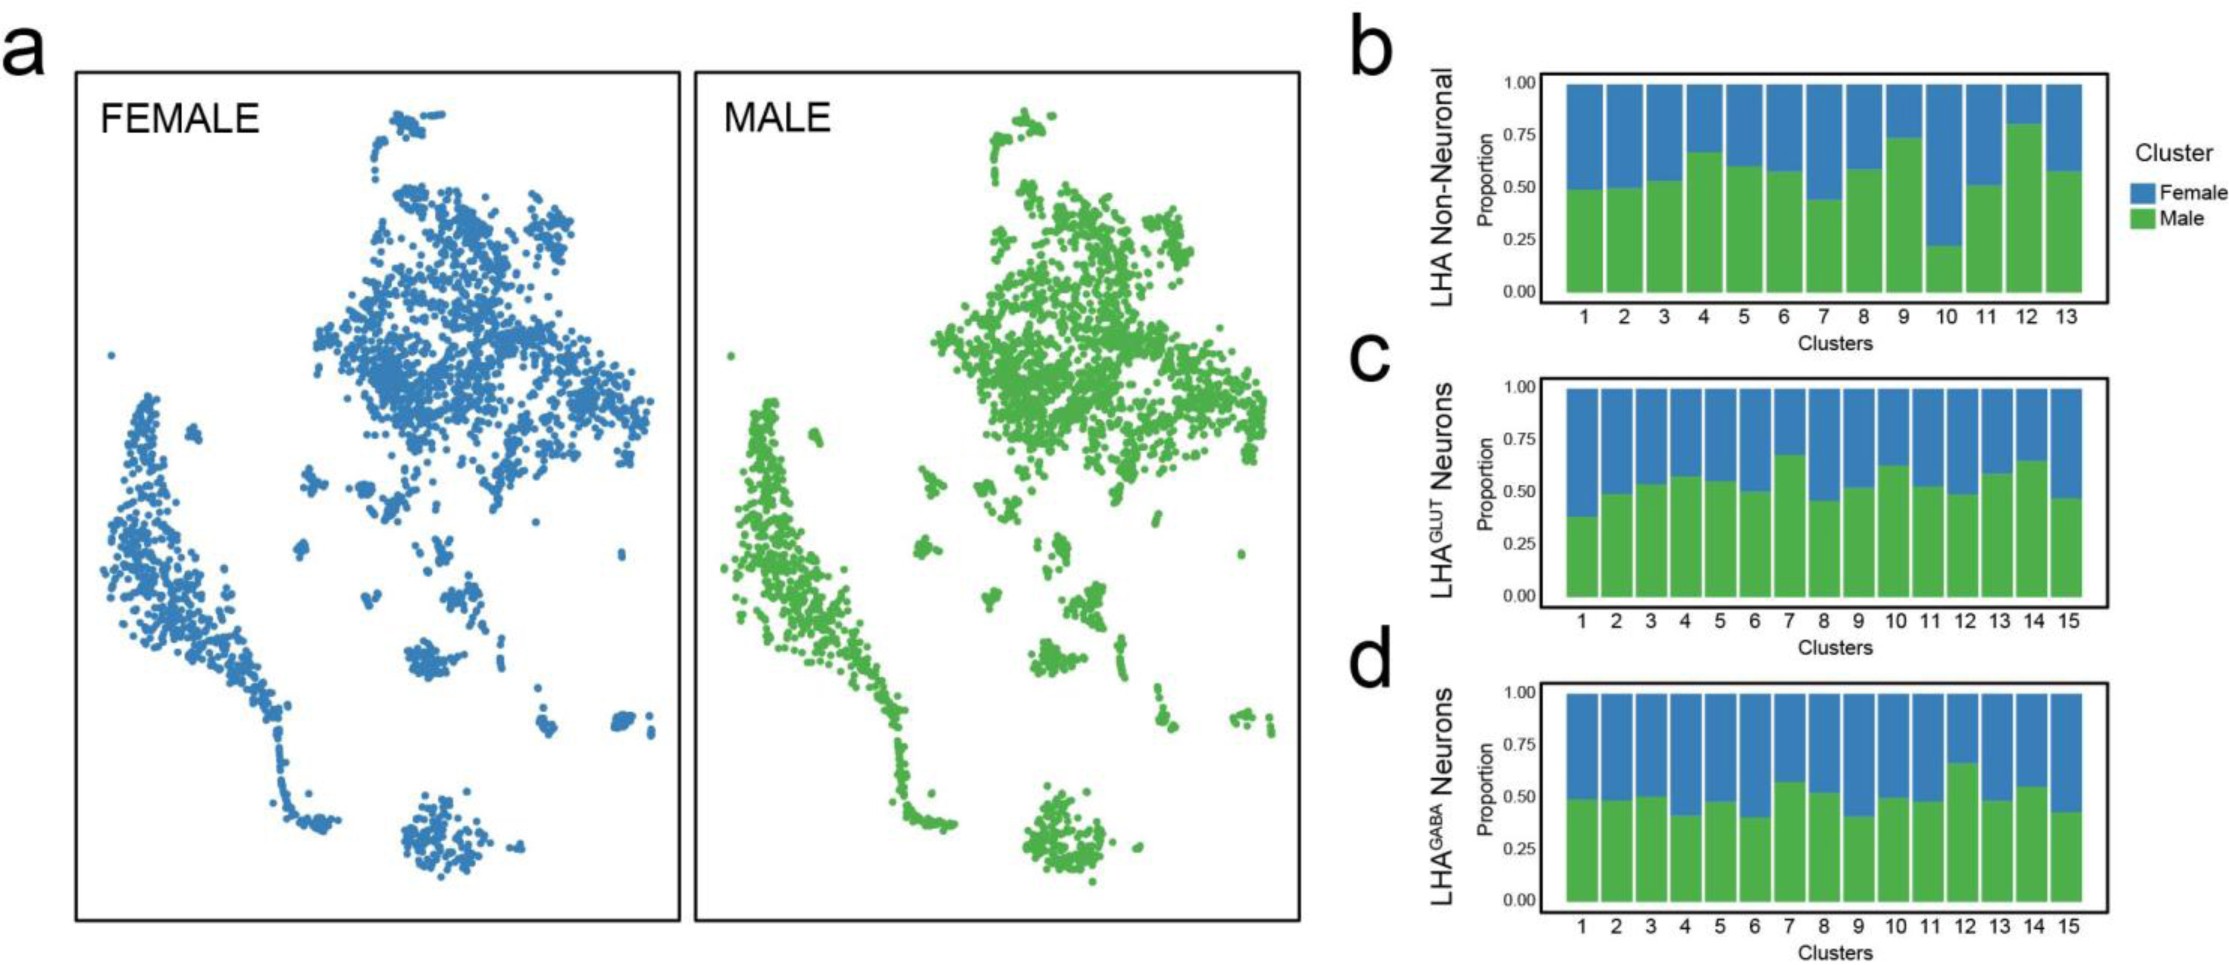
(a) Comparison of male (green) and female (blue) LHA cells (total n = 6944 cells; from 3 male and 2 female mice). LHA single cells shown on t-SNE plots after the first iteration of unsupervised clustering show near-identical cell type assignments. (b) Proportion of male vs. female cells that comprise the 13 clusters of non-neuronal cells; (c) 15 clusters of LHAGlut neurons; and (d) 15 clusters of LHAGABA neurons.
Supplementary Figure 2: Classification of major non-neuronal cell types in the LHA.

(a) Unsupervised clustering of non-neuronal cell types in the LHA represented as a t-SNE plot (n = 2536 cells). Different cell type clusters are color coded below. (b) Heatmap showing scaled expression of discriminative marker gene sets across all 13 non-neuronal clusters, with cells as columns and genes as rows (n = 2536 cells). Color scheme represents Z-score distribution with −3 (blue) to 3 (dark orange). (c) Violin plot, representing the distribution of log transformed normalized gene expression (gene UMIs/total cell UMIs) in each cluster, of selected markers for non-neuronal populations (n = 2536 cells). These include three populations of oligodendrocyte lineage cells: a large population of mature oligodendrocytes (cluster 1: Olig1+, Mag+, Opalin+); proliferating oligodendrocyte progenitors (cluster 3: Olig1+, Cspg4+, Pdgfra+); and immature oligodendrocytes (cluster 13: Olig1+, Mag+, Pdgfra-, Fyn+). Two clusters of astrocytes (clusters 6 and 8) exhibited robust expression of Gja1+, Aqp4+ and Agt+, but could be distinguished on the basis of Slc7a10 (high in 6, low in 8) and Gfap (low in 6, high in 8) expression. Other clusters were identified as endothelial cells (cluster 2: Flt1+); red blood cells (cluster 4: Hba-a1+); fibroblasts (cluster 5: Pdgfra+, Col1a2+, Gja1+); macrophages (cluster 7: C1qa+, Cx3cr1+, Mrc1+); pericytes (cluster 9: Cspg4+, Acta2+); and microglia (cluster 10: C1qa+, Cx3cr1+, Tmem119+). All neurons are represented as N. Number of cells, mean genes/cell and mean UMIs/cell is provided in Supplementary Table 1. (d) Distribution of genes and transcripts (UMIs) detected in each non-neuronal cell type in the data and all neurons (N).
Supplementary Figure 3: Genes and transcripts detected in LHAGlut and LHAGABA neuronal cell types in the LHA.

(a) Violin plots representing the distribution of log transformed normalized gene expression (gene UMIs/total cell UMIs) in each LHAGlut neuronal cluster in the data (n = 1537 cells). (b) Heatmap showing scaled expression (log CPM) of discriminative marker gene sets across all 15 LHAGlut clusters (n = 1537 cells), with cells as columns and genes as rows. Color scheme represents Z-score distribution with −3 (blue) to 3 (dark orange). (c) Violin plot showing distribution of genes and transcripts detected in each LHAGABA neuronal cluster in the data (n = 1900 cells). (d) Heatmap showing scaled expression (log CPM) of discriminative marker gene sets across all 15 LHAGABA clusters (n = 1900 cells), with cells as columns and genes as rows. Color scheme represents Z-score distribution with −3 (blue) to 3 (dark orange). Total number of cells, mean genes/cell and mean UMIs/cell is provided in Supplementary Table 1.
Supplementary Figure 4: Comparison of Allen Brain Atlas ISH expression for single discriminatory markers for each LHAGABA and LHAGlut cluster.
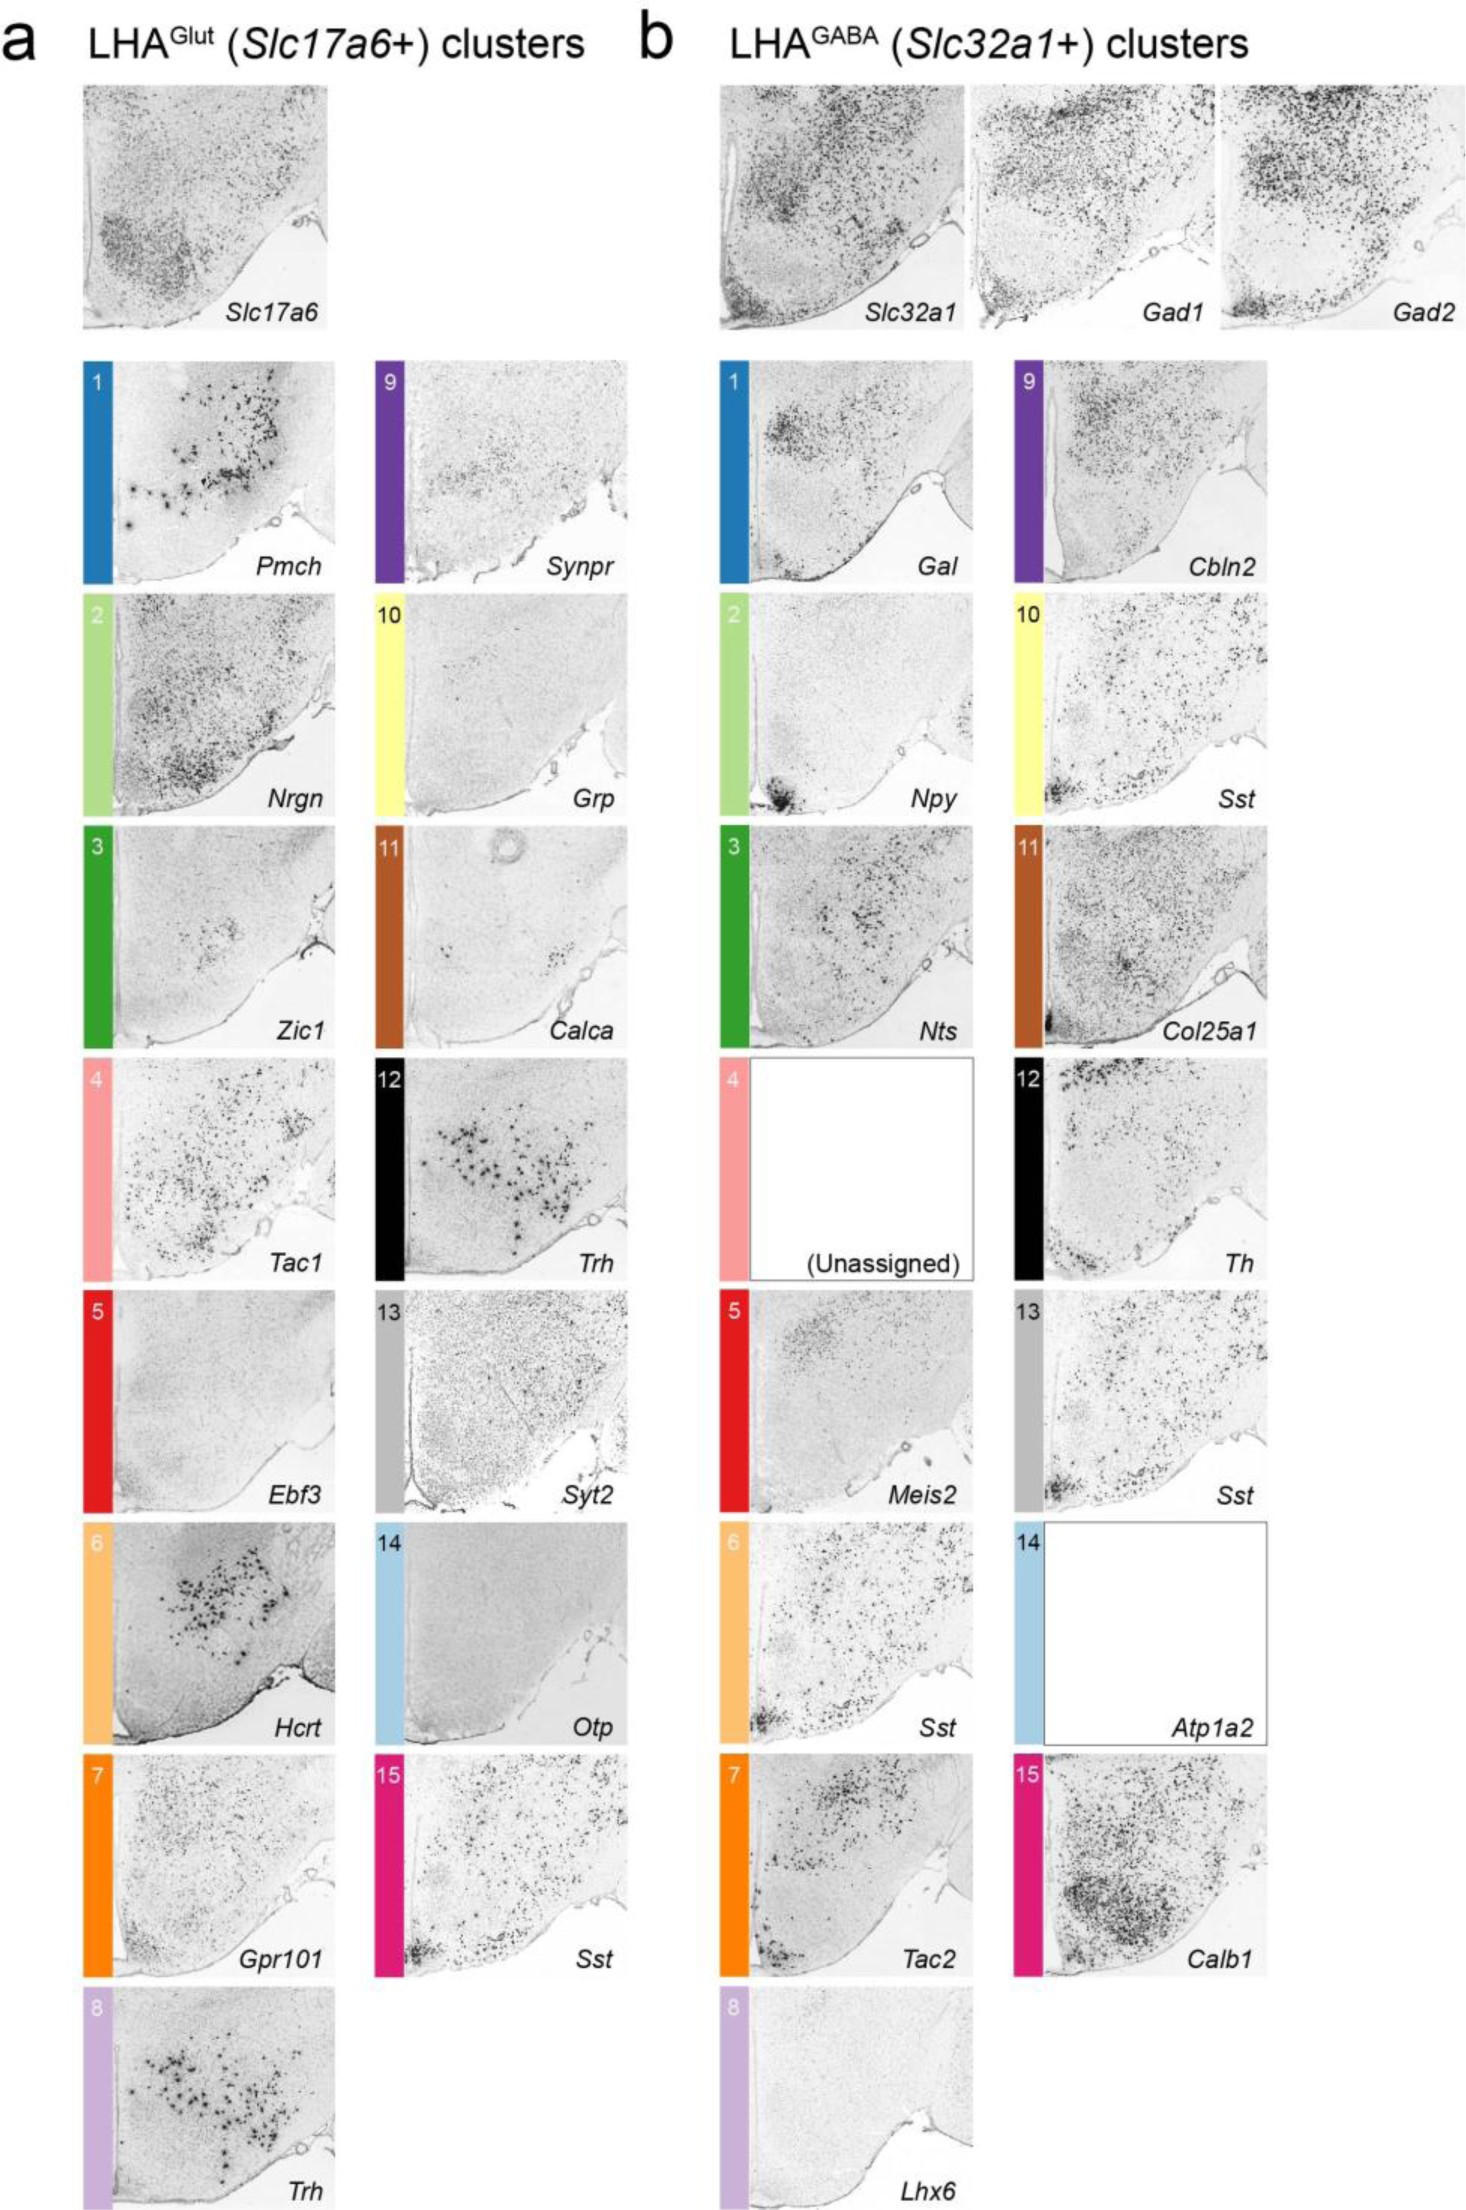
Representative Allen Mouse Brian Atlas (Lein et al, 2007) micrographs of ISH expression of single discriminatory markers for (a) LHAGlut clusters, and (b) LHAGABA clusters, in coronal sections containing the LHA (corresponding to middle/posterior LHA). Image credit for all ISH images: Allen Institute. Note that some identical ISH figures, for discriminatory markers that define more than one cluster, appear multiple times (ex. Sst, Trh), and one ISH is unavailable (Atp1a2).
reference: