

Abstract
Alzheimer’s disease is a pervasive neurodegenerative disorder, the molecular complexity of which remains poorly understood. Here, we analysed 80,660 single-nucleus transcriptomes from the prefrontal cortex of 48 individuals with varying degrees of Alzheimer’s disease pathology. Across six major brain cell types, we identified transcriptionally distinct subpopulations, including those associated with pathology and characterized by regulators of myelination, inflammation, and neuron survival. The strongest disease-associated changes appeared early in pathological progression and were highly cell-type specific, whereas genes upregulated at late stages were common across cell types and primarily involved in the global stress response. Notably, we found that female cells were overrepresented in disease-associated subpopulations, and that transcriptional responses were substantially different between sexes in several cell types, including oligodendrocytes. Overall, myelination-related processes were recurrently perturbed in multiple cell types, suggesting that myelination has a key role in Alzheimer’s disease pathophysiology. Our single-cell transcriptomic resource provides a blueprint for interrogating the molecular and cellular basis of Alzheimer’s disease.
Methods
Cell clustering
All 75,060 cells were combined into a single dataset. Normalization and clustering were done with the SCANPY package. In brief, counts for all nuclei were scaled by the total library size multiplied by 10,000, and transformed to log space.
A total of 3,188 highly variable genes were identified based on dispersion and mean, the technical influence of the total number of counts was regressed out, and the values were rescaled. These preprocessing steps were performed by sequentially using the functions normalize_per_cell, filter_genes_dispersion, log1p.regress_out, and scale in SCANPY.
Principal component analysis (PCA) was performed on the variable genes, and t-SNE was run on the top 10 principal components (PCs) using the Multicore-TSNE package (https://github.com/DmitryUlyanov/Multicore-TSNE). The top 50 PCs were used to build a k-nearest-neighbours cell–cell graph with k = 30 neighbours; subsequently spectral decomposition over the graph was performed with 15 components, and the Louvain graph-clustering algorithm was applied to identify cell clusters. These analyses were performed using the functions pca, neighbours, and louvain in SCANPY.
We confirmed that a number of PCs greater than 30 captures 100% of the variance of the data. The initial pre-clustering analysis resulted in 20 pre-clusters with a median number of 2,990 cells, ranging from 413 to 15,900 cells, after excluding 2 pre-clusters of 360 and 791 cells that reflected low-quality cells (that is, cells that showed mixed cell-type markers; extreme complexity with many more genes expressed than other cells; either too many or too few reads; and, in one case, cells isolated almost exclusively from one individual). For each pre-cluster, differentially expressed genes were detected using the variance-adjusted t-test as implemented in the function rank_genes_groups in SCANPY.
The top 500 ranking genes were extracted for each cluster, and used to test for overlap with markers as previously reported. The same clustering protocol was used for both pre- and sub-clustering analyses. During sub-clustering, additional potentially spurious clusters representing low-quality or doublet cells were detected on the basis of extreme separation from the rest of the sub-clusters from the same cell type. Of these, those having a distinctly high number of total counts and mixed expression of markers from different cell types were tagged as potential doublets and not considered for downstream analyses, resulting in a total of 70,634 cells.
Cell type annotation and sub-clustering
For each pre-cluster, we assigned a cell-type label using statistical enrichment for sets of marker genes and manual evaluation of gene expression for small sets of known marker genes. Enrichment was statistically assessed using the hypergeometric distribution (Fisher’s exact test) and FDR correction over all gene sets and pre-clusters. Broad cell-type clusters were defined by grouping together all pre-clusters corresponding to the same cell type. Sub-clustering analysis was performed independently over each broad cell-type cluster.
Marker identification
For sub-clusters, a set of markers (specifically overexpressed) genes was defined by a differential expression analysis of the cells grouped in each sub-cluster against the remaining cells within the corresponding broad cell-type cluster. This analysis was applied to all cell types independently. Significantly overexpressed genes were defined based on the Wilcoxon rank-sum test with a FDR-corrected P value ≤ 0.01 and a log2(mean gene expression across cells in sub-cluster/mean gene expression across cells in other sub-clusters) of 0.5. Only genes detected in at least 25% of the cells within the given sub-cluster were considered.
Gene Ontology enrichment analyses were performed using the R package gProfileR (https://cran.r-project.org/web/packages/gProfileR/index.html) and using the P value-ranked gene lists as input. For all cases we used the set of 17,926 protein-coding genes included in the quality control data as background.
Differential gene-expression analysis
snRNAseq-based differential expression analysis was assessed using two tests.
- First, a cell-level analysis was performed using the Wilcoxon rank-sum test and FDR multiple-testing correction.
- Second, a Poisson mixed model accounting for the individual of origin for nuclei and for unwanted sources of variability was performed using the R packages lme4 and RUV-seq, respectively.
The consistency of DEGs detected using the cell-level analysis model with those obtained with the Poisson mixed model was assessed by comparing the directionality and rank of DEGs in the two models. Consistency in directionality for all cell types was measured by counting the fraction of the top 1,000 DEGs (ranked by FDR scores) detected in cell-level analysis that showed consistent direction in the mixed model. High consistency was found, with a median fraction of 0.99. Global consistency between the two models was assessed statistically using a resampling test. We tested whether the differential P value and z-score ranks corresponding to genes detected as upregulated or downregulated in the cell-level analysis were significantly higher or lower than those that were expected by chance when computed using the mixed model. Expected scores were estimated by randomly sampling same-sized gene sets (n = 1,000 replicates). Both significance rank and direction deviated significantly from expectation, with directionality consistent for up- or downregulated genes. Results from the consistency tests and from both the cell-level and mixed-model differential tests are included in Supplementary Table 2. For analyses involving DEG counts, only genes that were significantly supported by both models using the criteria FDR-corrected P < 0.01 in a two sided Wilcoxon-rank sum test, absolute log2(mean gene expression in AD category x/mean gene expression in AD category y) > 0.25, and FDR-corrected P < 0.05 in a Poisson mixed model were considered. Owing to their low cell counts, pericyte and endothelial cell populations were excluded from differential analyses.
Bulk RNA-seq differential analysis was performed by fitting a linear model using the R package limma, accounting for the covariates age, RNA integrity number, post-mortem interval, and plate batches. The pathological definition of AD groups provided by ROSMAP was used. This classification defines AD or non-AD groups based exclusively on the overall pathological burden, without considering clinical diagnosis. We used the labels AD-pathology and no-pathology for consistency.
Consistency of gene-expression perturbations in the different cell types observed in snRNA-seq data with those detected in tissue-level bulk RNA-seq was assessed using a resampling approach. To test whether the genes identified as DEGs in single-cell data were also detected as high ranking in the differential analysis in bulk data, a z-score statistic was computed to quantify the deviation of the observed differential (P value) rank scores obtained in the bulk analysis for the genes detected as DEGs in single cells, relative to those observed in 1,000 randomly chosen gene sets. This analysis was performed for each cell type independently.
Figure
Fig. 1: Cell-type-specific gene-expression changes in AD pathology.

a, Genes most upregulated: excitatory (Ex) and inhibitory (In) neurons, astrocytes (Ast), oligodendrocytes (Oli), oligodendrocyte precursor cells (Opc), and microglia (Mic). b, DEG counts for each cell type (two-sided Wilcoxon rank-sum test, FDR < 0.01, log2(mean gene expression in AD-pathology/mean gene expression in no-pathology) > 0.25, Poisson mixed-model FDR < 0.05). The intensity of the blue colour and the size of the squares are proportional to entry values. c, RT–qPCR validation. snRNA-seq differential scores for excitatory- and inhibitory-neuron DEGs (z-score, Poisson mixed model) (left) and qPCR validation (right). NeuN-positive nuclei were isolated by fluorescence-activated cell sorting (n = 8 AD-pathology individuals and n = 8 no-pathology individuals). Data are mean ± s.e.m.; *P < 0.001, ***P < 0.01, \*P < 0.05; NS, \P > 0.05 (Student’s two-tailed t*-test). d, e, Differential scores (z-scores, Poisson mixed model) for the top DEGs from snRNA-seq (d), and the corresponding values from bulk RNA-seq (e) (ROSMAP cohorts; n = 484, P < 0.01). f, Global consistency analysis of snRNA-seq versus bulk RNA-seq. Agreement or disagreement was estimated by deviation from random expectation (z-score) of single-cell DEG average rank scores in the ranked list of genes from bulk differential analysis. g, Differential expression of APOE in microglia (n = 955 cells, 24 AD-pathology individuals; n = 965 cells, 24 no-pathology individuals) and astrocytes (n = 1,830 cells, 24 AD-pathology individuals; n = 1,562 cells, 24 no-pathology individuals; z-score, Poisson mixed model; **P = 0.001, \*P = 0.05, corresponding P value calculated from two-sided, standard normal distribution). h, Binary plots indicating with bars whether a gene (column) is a DEG in a given cell type (rows) or not (n* = 1,031 DEGs). Right, six genes associated with myelination and/or axon regeneration.
Fig. 2: Gene-expression changes in the progression of AD pathology.
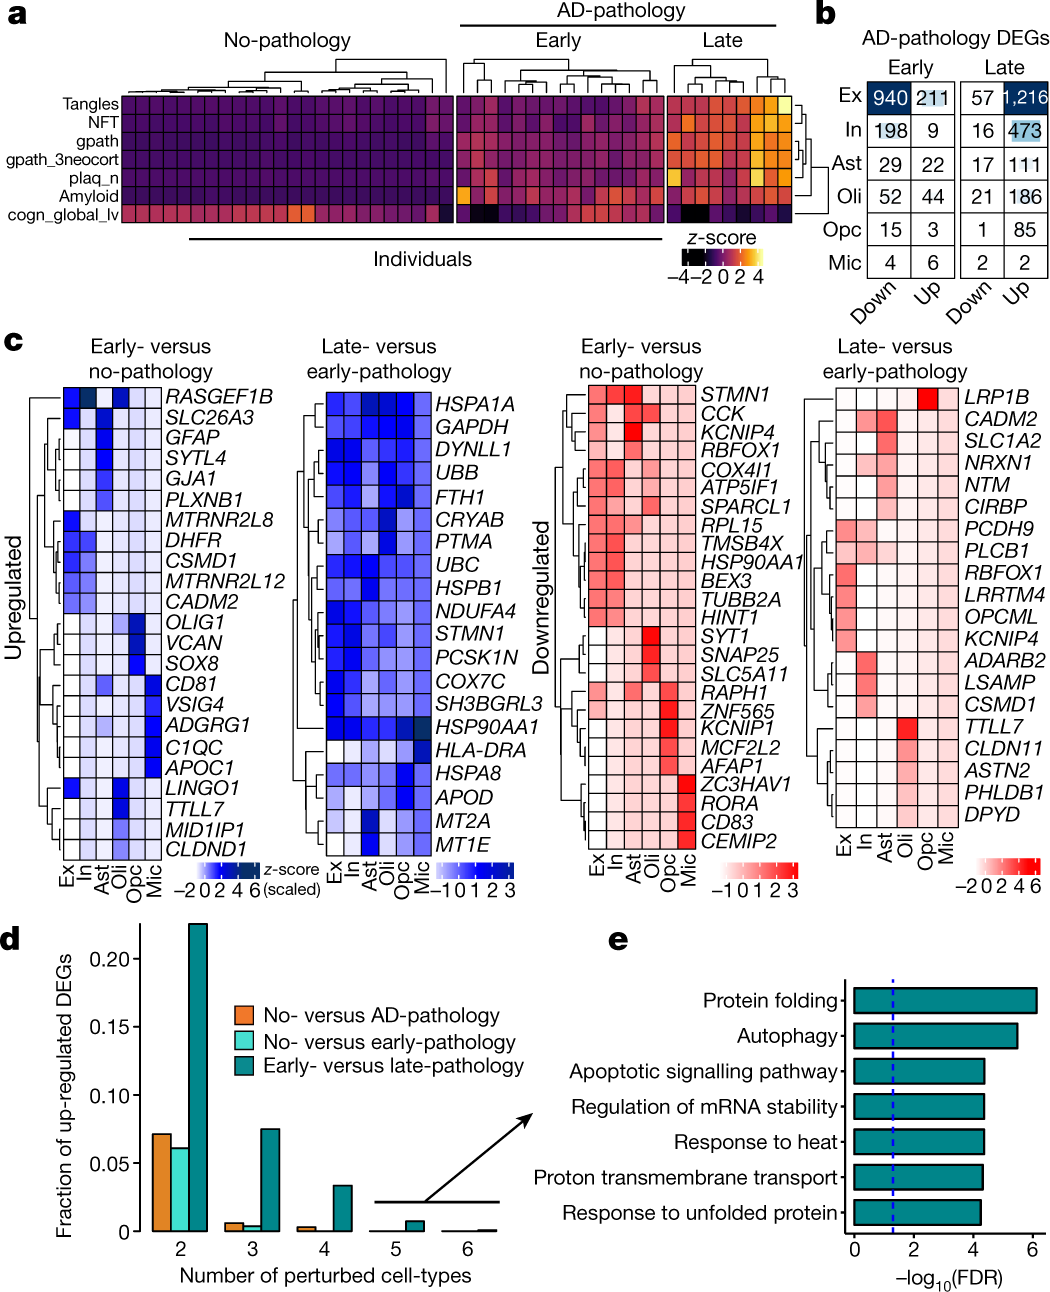
a, Phenotypic clustering of 48 individuals (columns) using clinico-pathological variables (rows) measuring neuronal neurofibrillary tangle density (tangles), neurofibrillary tangle burden (NFT), global AD-pathology burden (gpath), global measure of neocortical pathology (gpath_3neocort), neuritic plaque burden (plaq_n), overall amyloid level (amyloid), and global cognitive function (last valid score) (cogn_global_lv). b, Progressive changes in DEG counts for each cell type for early and late AD-pathology individuals (two-sided Wilcoxon rank-sum test, FDR < 0.01, log2(mean gene expression in early-pathology/mean gene expression in no-pathology) > 0.25 or log2(mean gene expression in late-pathology/mean gene expression in early-pathology) and similarly for the opposite direction, Poisson mixed-model FDR < 0.05). The intensity of the blue colour and the size of the squares are proportional to entry values. c, Most-significantly altered (based on P value rank) genes (rows) for each cell type (columns) and comparison. Column-scaled z-scores computed with a Poisson mixed model are shown (FDR < 0.01, two-sided Wilcoxon rank-sum test). d, Fraction of total upregulated genes (y axis) as a function of the total number of cell types in which the upregulation occurs. e, Gene Ontology terms associated with genes upregulated in the late-pathology group that are common to ≥5 cell types (n = 11 genes, hypergeometric test, FDR correction).
Fig. 3: Trait associations in cellular subpopulations.

a–d, Overrepresentation (hypergeometric test) within each sub-cluster of cells isolated from individuals with varying amyloid levels (a), Braak stage (braaksc) (b), cognitive status at time of death (cogdx, 1 = no impairment; 4 = impairment) (c), and sex (d). Only significant associations after FDR correction over all variables and subpopulations are displayed. e, Fraction of cells in each sub-cluster. f, Quantitative enrichment of clinico-pathological features across sub-clusters for: global AD-pathology burden, neurofibrillary tangle burden; neuritic plaque count, overall amyloid level, and global cognitive function (global_cogn); z-scores were estimated using resampling. The size of the squares is proportional to the numeric entry. g, Immunohistochemistry with anti-OLIG2 (red) and anti-CRYAB (green) antibodies in the white matter of Brodmann area 10 of a no-pathology and an AD-pathology individual (scale bars (top left, white), 10 μm). The experiment was performed once. h, Similar to g, for anti-OLIG2 (red) and anti-QDPR (green). The experiment was performed once.
Fig. 4: Sex-specific differential response to AD pathology.
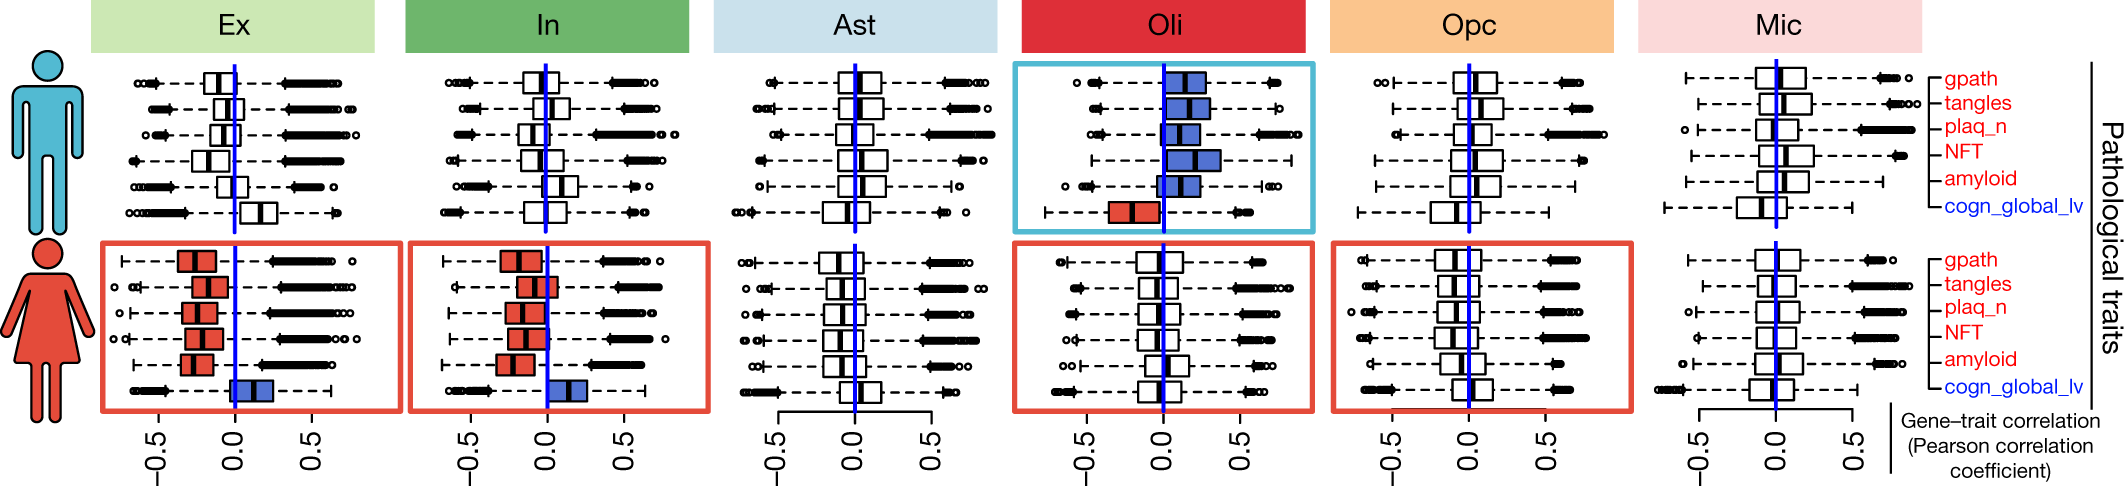
Individual-level transcriptome-wide gene–trait correlation analysis. Box plots show the distribution of correlation values (Pearson correlation coefficient) computed between gene-expression profiles (n = 17,926 genes) averaged for cells of each type across each individual, and the corresponding pathological measurements across individuals (n = 24 female individuals and n = 24 male individuals). Box plots are centred around the median, with the interquartile range (IQR) defining the box. The upper whisker extends to the largest value no further than 1.5 × IQR from the end of the box. The lower whisker extends to the smallest value at most 1.5 × IQR from the end of the box. Pathological traits are represented in red font and cognition in blue. Rectangles around plots highlight the most contrasting differences observed between male and female transcriptional responses; blue indicates a dominant positive correlation and red a dominant negative correlation.
Extended Data Fig. 2: snRNA-seq profiling and cell-type characterization.
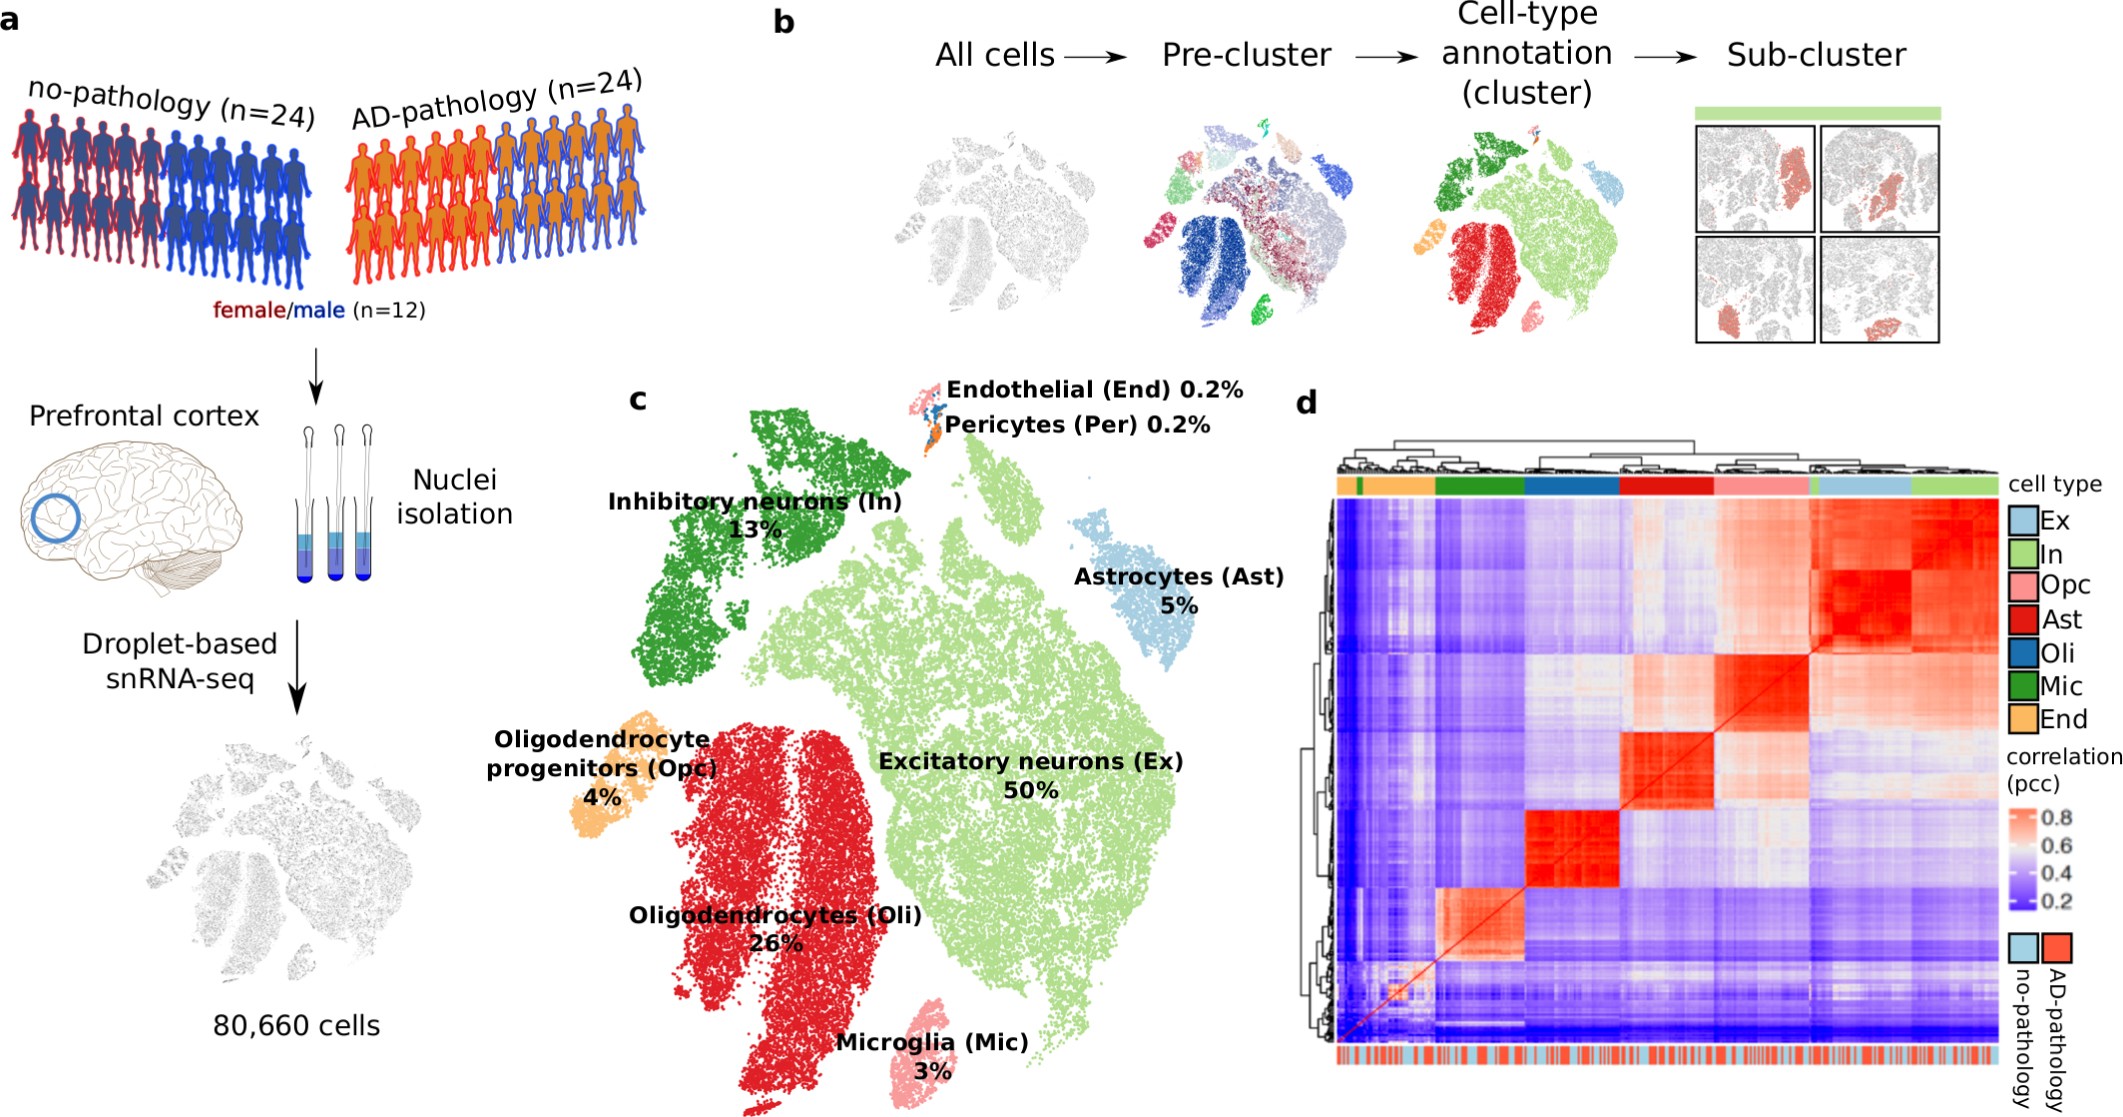
a, Study cohort and sample preparation. b, Clustering analysis workflow. c, Two-dimensional t-SNE projection of all annotated cells (n = 75,060 from 24 pathology and 24 no-pathology individuals). d, Correlation matrix (Pearson correlation coefficient; pcc) of the average expression profiles by cell type for each individual.
Extended Data Fig. 3: Consistency of cells of the same type across individuals.

a, Expression of known cell-type marker genes for each cell type. b, Left, expression of known cell-type marker genes in each cluster; right, fraction of cells in each cluster that express each marker gene. Vertical dashed blue line represents a scale bar referencing 0.5. c, Overrepresentation analysis (hypergeometric test) within each of the pre-cluster marker sets (rows) of genes previously identified as markers18 (columns, left; n = 1,729 total genes) and genes previously identified as markers of cortical layers21 (columns, right; n = 3,400 total genes). d, Fraction of cells of each type isolated across all (n = 48), no-pathology (n = 24), and AD-pathology (n = 24) individuals. e, Fraction of cells of each type isolated from each individual (columns; n = 48).
Extended Data Fig. 4: Expression values and validation of top DEGs.
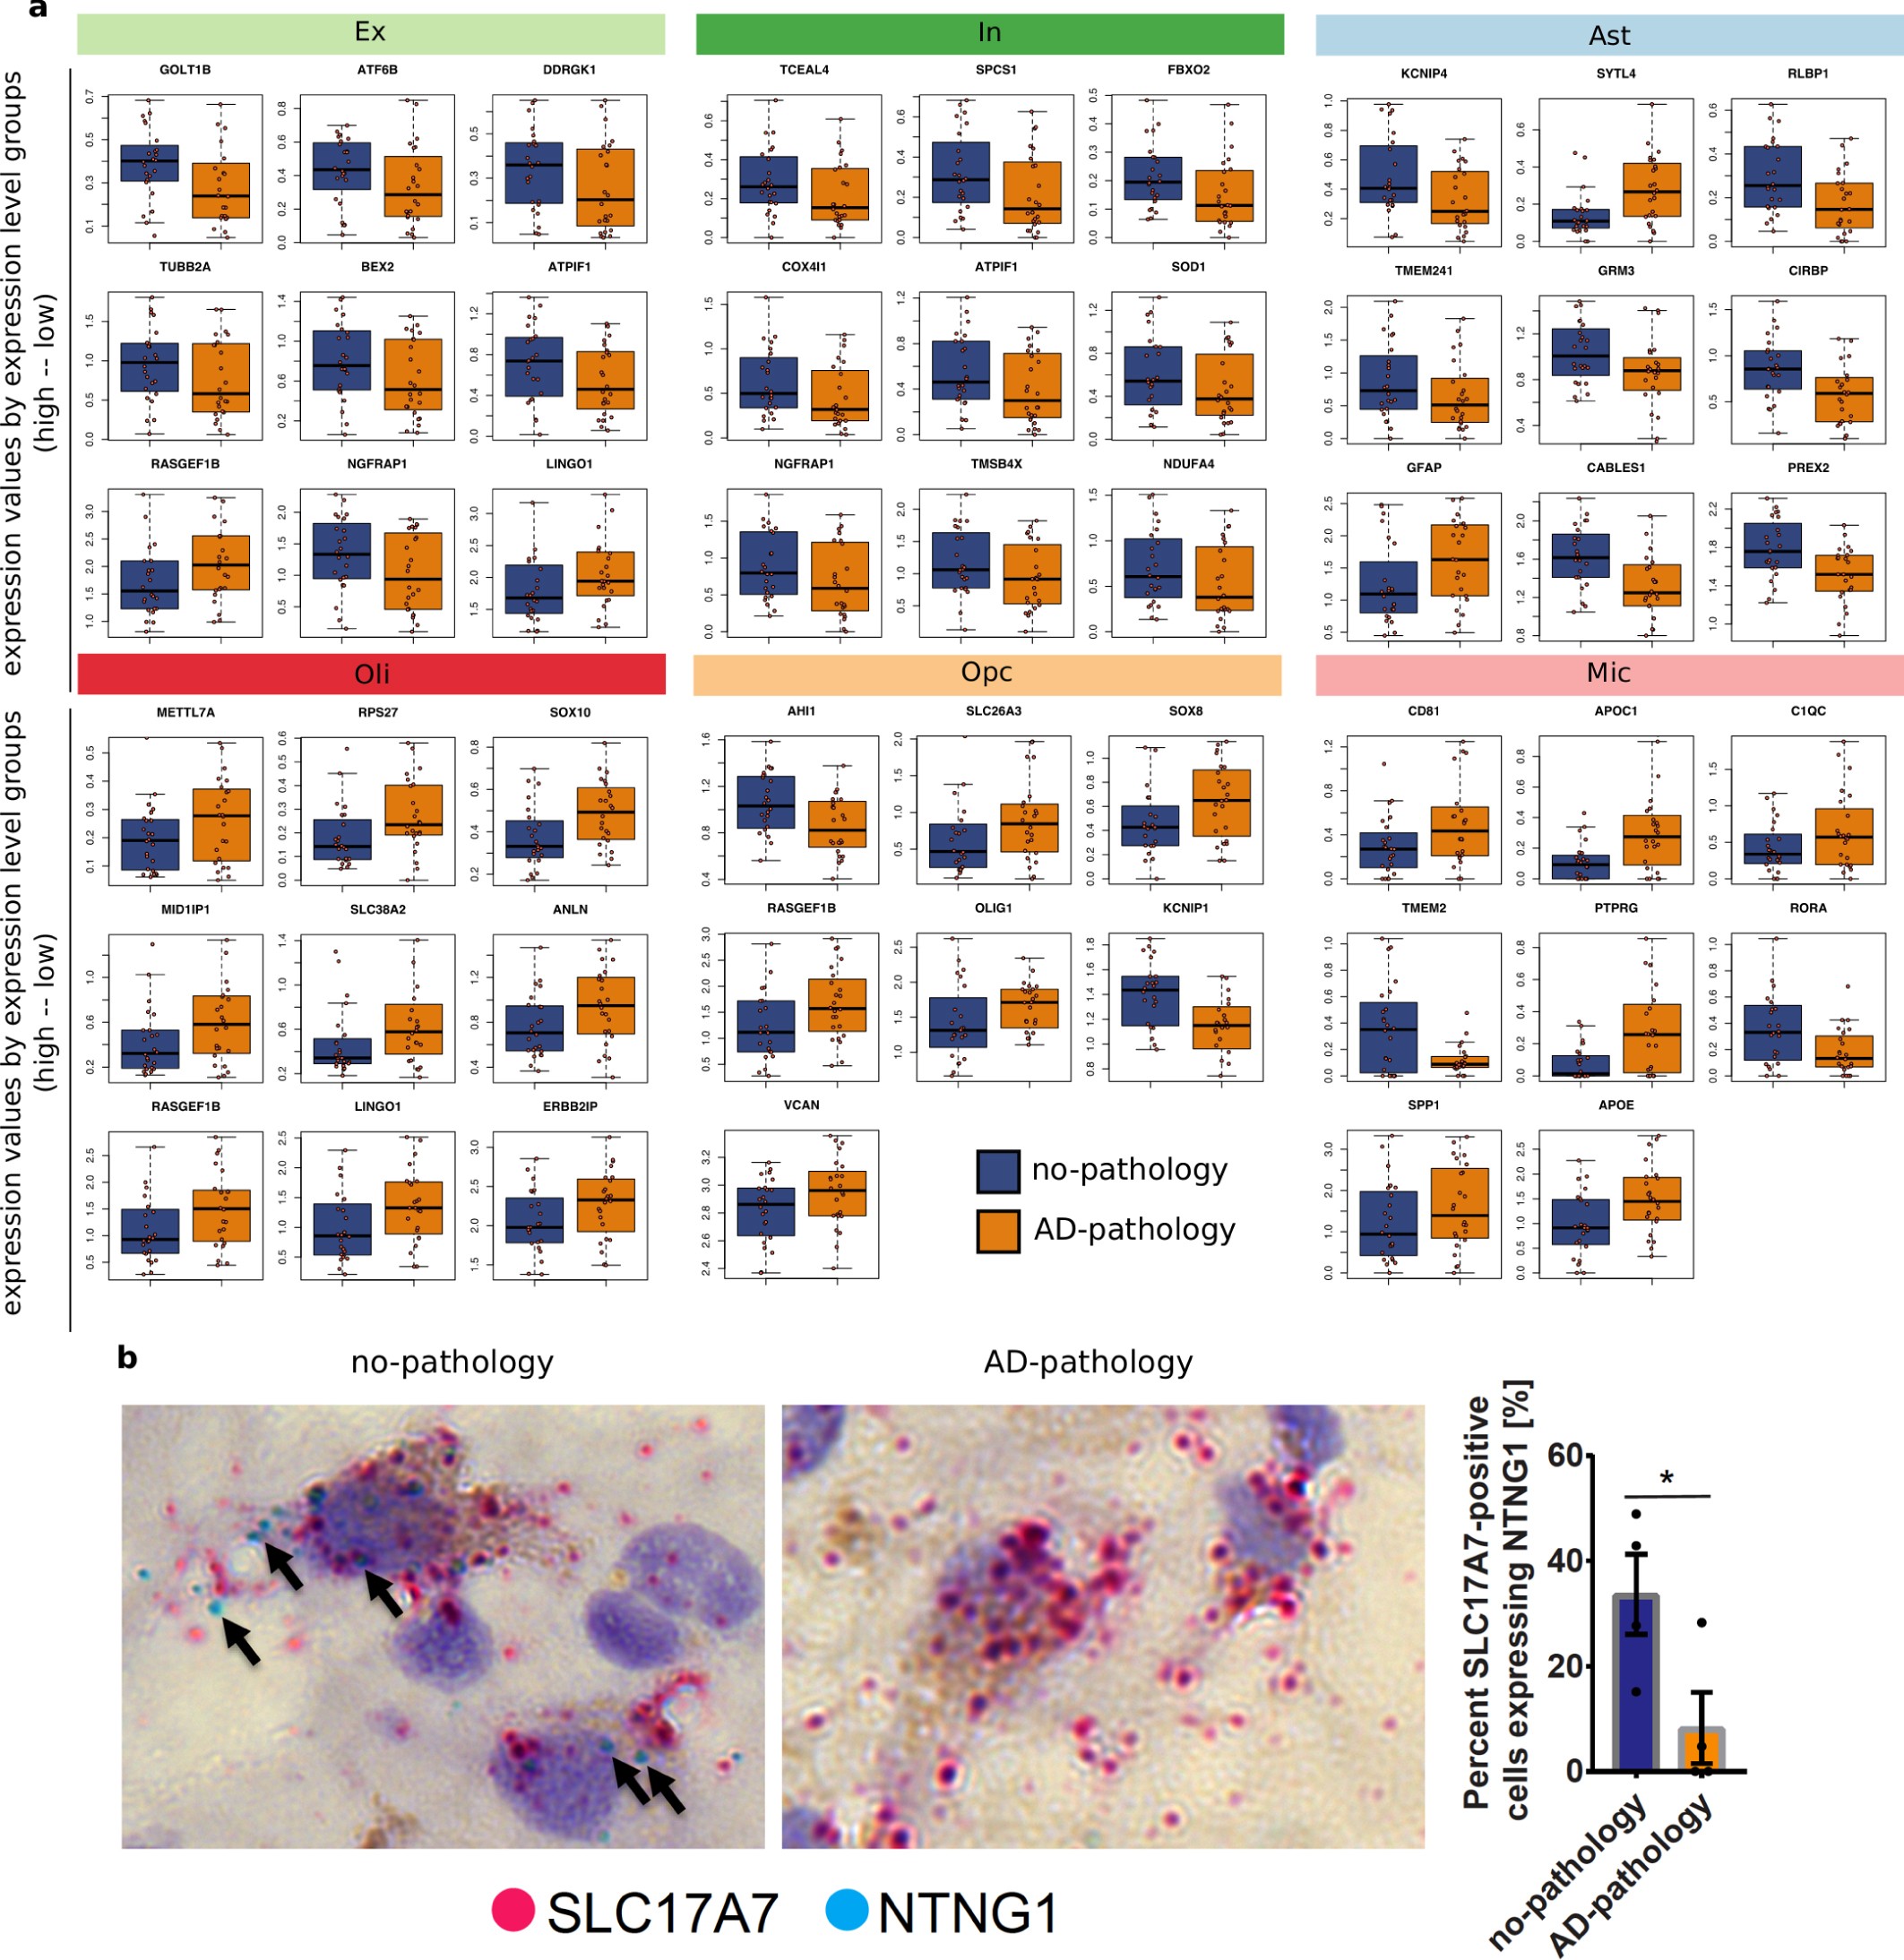
a, Mean expression values of genes across the nuclei isolated from each individual. Each point represents one individual. DEGs were classified as low, mid, or high in expression, based on their median expression level across the cells of the corresponding cell type. Groups were defined based on k-means clustering (k = 3). The top three genes for each group (low-, mid-, and high-expression levels) and for each cell type are shown. For oligodendrocyte precursor cells and microglia, only one and two genes, respectively, were classified within the high-expression group. ATPIF1 is also known as ATP5IF1, NGFRAP1is also known as BEX3, TMEM2 is also known as CEMIP2, and ERBB2IP is also known as ERBIN. b, Left, RNA in situ hybridization (RNAscope) with probes that detect the excitatory neuron marker SLC17A7 (red) and NTNG1 (blue) in the grey matter of Brodmann area 10 of a no-pathology and an AD-pathology individual. The tissue was counterstained with haematoxylin. Right, quantification of RNA in situ hybridization on Brodmann area 10 tissue sections. Data are mean ± s.e.m.; *P = 0.047 (Student’s two-tailed t-test). n = 4 no-pathology and n = 4 AD-pathology individuals; n = 5 or 6 images per individual.
Extended Data Fig. 5: Overlap of genes that are altered in the progression of AD pathology.
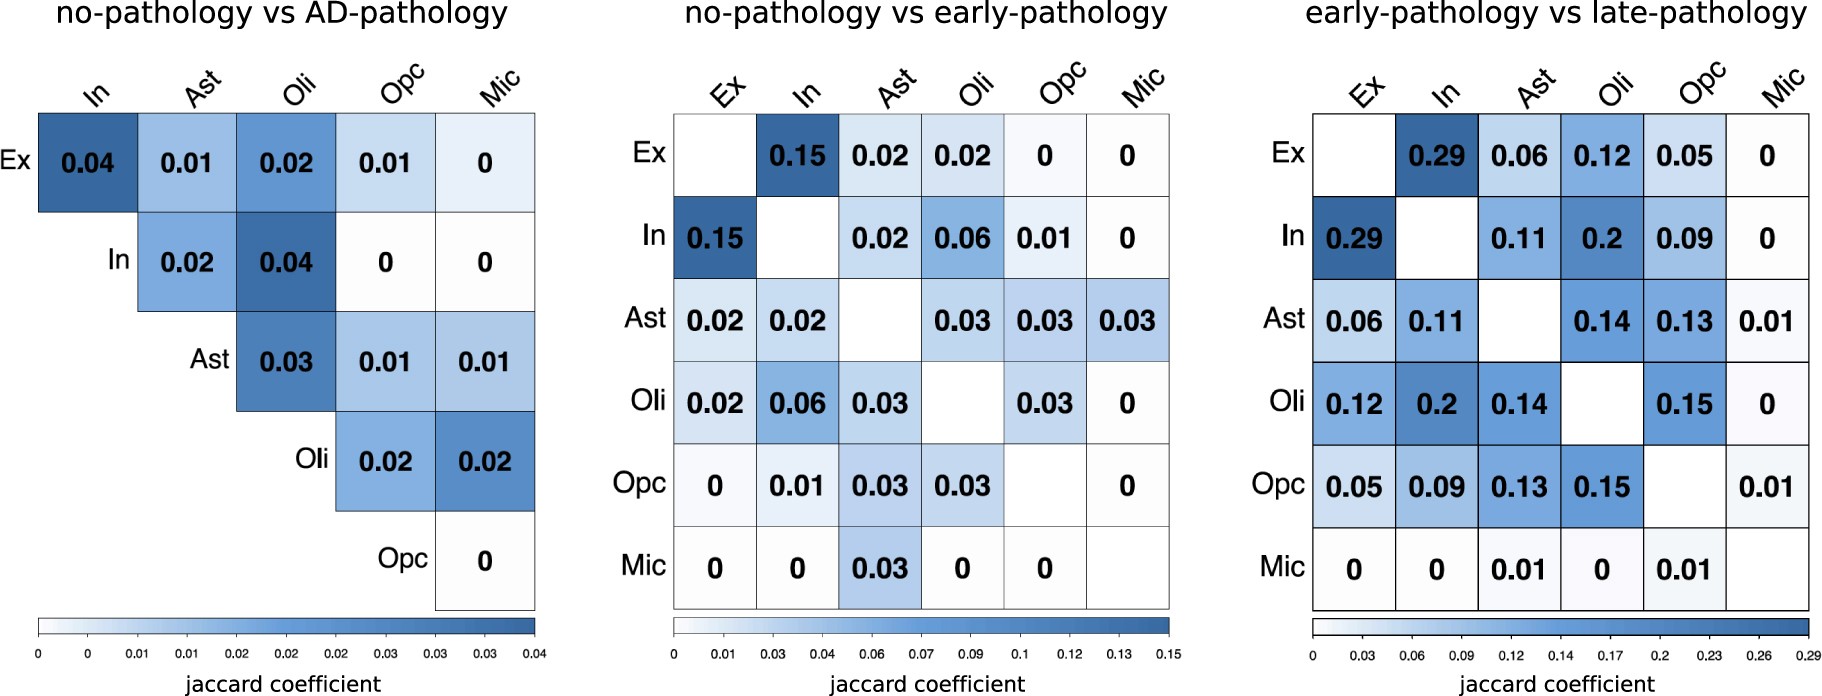
Quantification of the overlap (Jaccard coefficient) between pairs of gene sets identified as differentially expressed in each of the major cell types when comparing cells isolated from AD-pathology individuals with cells isolated from no-pathology individuals, and combinations of early- and late-pathology individuals.
Extended Data Fig. 7: Overrepresentation analyses for cells in sub-clusters.
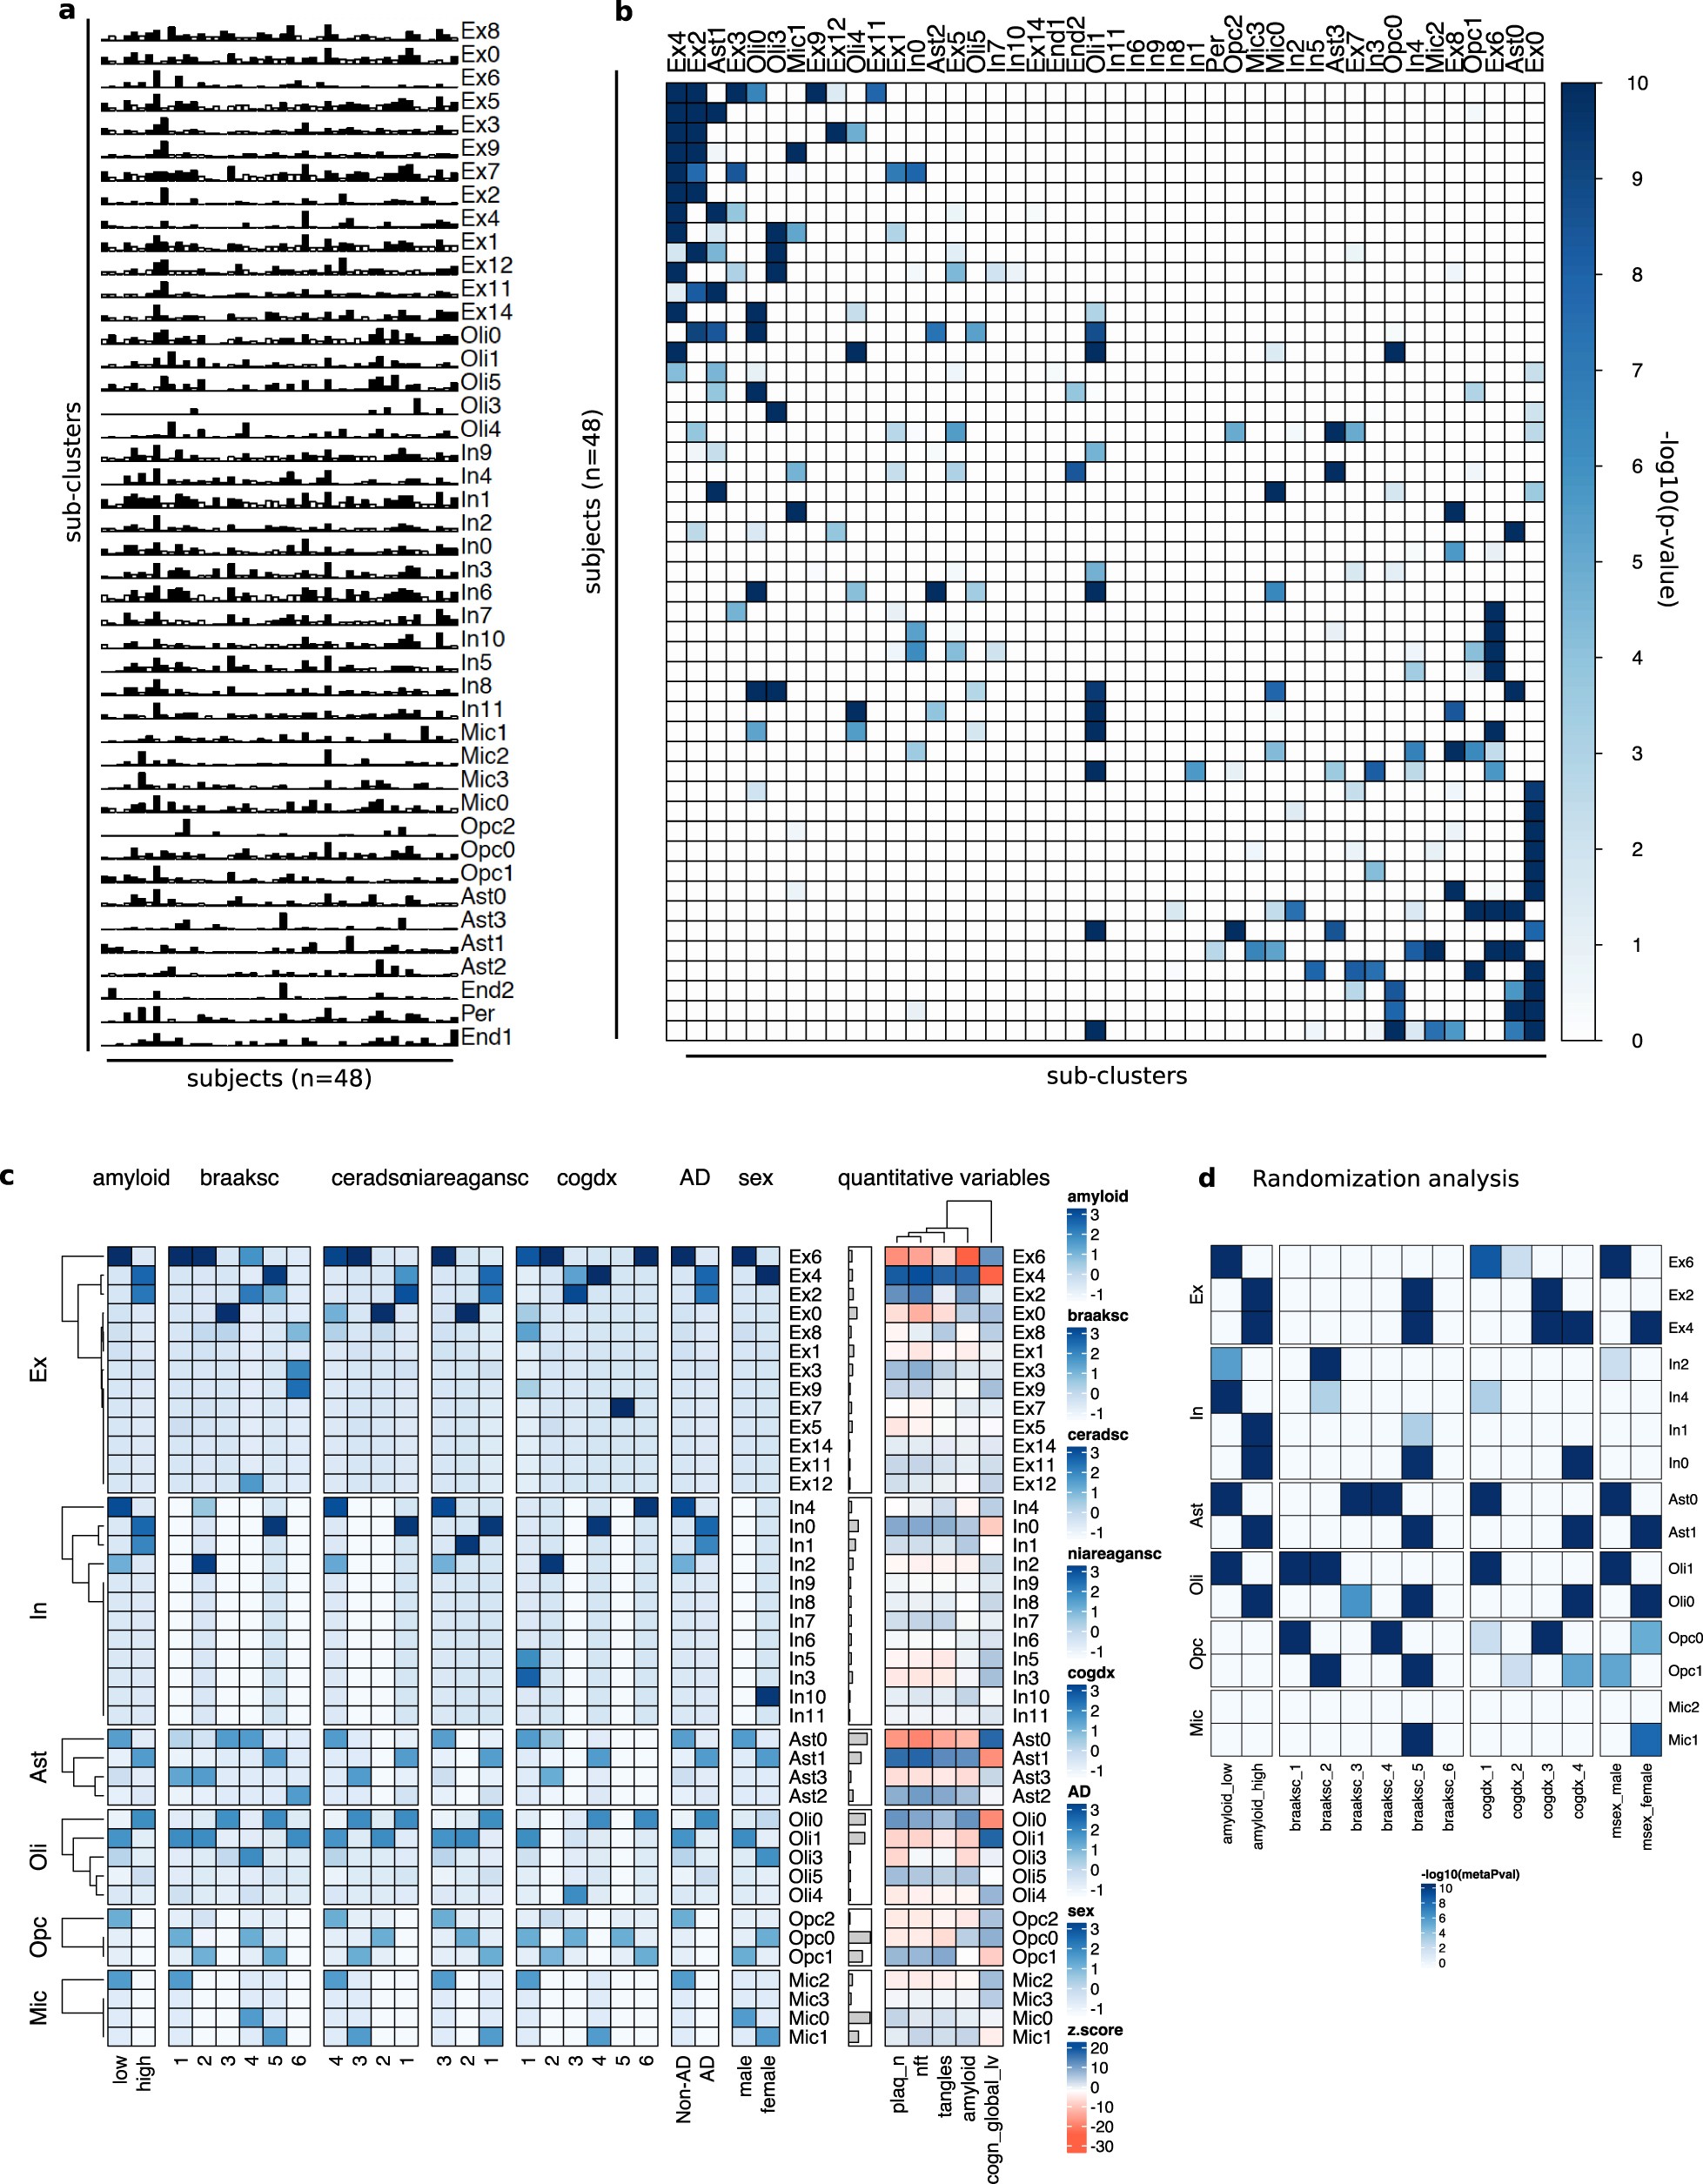
a, Cell composition of each identified sub-cluster (rows) across individuals (columns). Bars represent the fraction of cells corresponding to each individual. Bar colour indicates whether the corresponding value exceeds (black) or does not exceed (white) the average value measured across all the entries in the row. b, Overrepresentation analysis (hypergeometric test) within each pre-cluster (columns) of cells isolated from each individual (rows). c, Overrepresentation analysis within each sub-cluster of cells isolated from individuals with different values of discrete clinico-pathological variables (overall amyloid level, Braak stage, CERAD score (ceradsc), NIA–Reagan score (niareagansc), clinical consensus diagnosis of cognitive status at the time of death (cogdx), and sex). The scale bars on the right indicate the significance of the overrepresentation (hypergeometric test, −log10(P value), z-scaled, FDR multiple-testing correction). For quantitative variables, enrichment was computed based on an estimated z-score quantifying the deviation from random expected values using resampling (Methods). The quantitative variables considered were neuritic plaque count, neurofibrillary tangle burden, tangle density, overall amyloid level, and global cognitive function. For a detailed description of clinico-pathological variables, see Supplementary Information. d, Overrepresentation analysis (hypergeometric test) similar to that in a, but computed only across cells isolated from randomly chosen female and male individuals for AD-pathology and no-pathology groups (Methods). Scores represent aggregated P values (meta-p values, meanp method, metap R package) computed across 100 random realizations. Only scores with a FDR < 0.01 (correction across traits × subpopulations) are plotted.
Extended Data Fig. 8: Cell-type subpopulations.

Cells from sub-clusters enriched (red) or depleted (blue) with cells for individuals with AD pathology and cognitive decline shown using t-SNE for major cell types (Ast1 n = 1,134, Ast0 n = 1,728, Oli0 n = 8,310, Oli1 n = 8,032, Ex4 n = 3,198, Ex6 n = 2,757, In0 n = 2,368, In2 n = 984, Opc0 n = 1,589, Opc1 n = 976, Mic1 n = 509, and Mic2 n = 169 cells). Left, corresponding marker genes (font proportional to enrichment level); right, enriched Gene Ontology terms. Gene Ontology enrichment was based on FDR-corrected cumulative hypergeometric P values, with P value-ranked gene-marker lists (FDR < 0.01, log2(mean gene expression across cells in sub-cluster/mean gene expression across cells in other sub-clusters) > 0.5, two-sided Wilcoxon rank-sum test) used as input (Ex4 n = 783, Ex6 n = 2,438, In0 n = 1,702, In2 n = 350, Ast1 n = 574, Ast0 n = 73, Oli0 n = 227, Oli1 n = 73, Opc0 n = 19, Opc1 n = 536, Mic1 n = 487, and Mic2 n = 646).
reference: